Supplementary information (docx 1655K)
advertisement
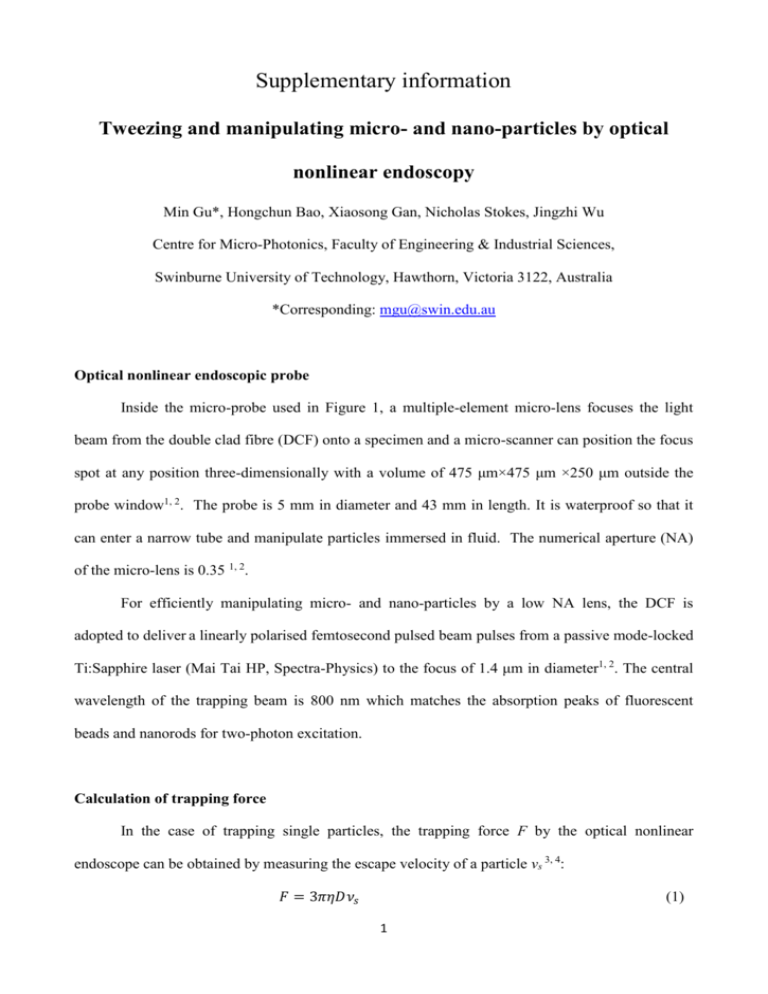
Supplementary information Tweezing and manipulating micro- and nano-particles by optical nonlinear endoscopy Min Gu*, Hongchun Bao, Xiaosong Gan, Nicholas Stokes, Jingzhi Wu Centre for Micro-Photonics, Faculty of Engineering & Industrial Sciences, Swinburne University of Technology, Hawthorn, Victoria 3122, Australia *Corresponding: mgu@swin.edu.au Optical nonlinear endoscopic probe Inside the micro-probe used in Figure 1, a multiple-element micro-lens focuses the light beam from the double clad fibre (DCF) onto a specimen and a micro-scanner can position the focus spot at any position three-dimensionally with a volume of 475 μm×475 μm ×250 μm outside the probe window1, 2. The probe is 5 mm in diameter and 43 mm in length. It is waterproof so that it can enter a narrow tube and manipulate particles immersed in fluid. The numerical aperture (NA) of the micro-lens is 0.35 1, 2. For efficiently manipulating micro- and nano-particles by a low NA lens, the DCF is adopted to deliver a linearly polarised femtosecond pulsed beam pulses from a passive mode-locked Ti:Sapphire laser (Mai Tai HP, Spectra-Physics) to the focus of 1.4 μm in diameter1, 2. The central wavelength of the trapping beam is 800 nm which matches the absorption peaks of fluorescent beads and nanorods for two-photon excitation. Calculation of trapping force In the case of trapping single particles, the trapping force F by the optical nonlinear endoscope can be obtained by measuring the escape velocity of a particle νs 3, 4: 𝐹 = 3𝜋𝜂𝐷𝜈𝑠 (1) 1 where η is the viscosity of the medium and D is the diameter of a particle. Then the trapping efficiency Qtr is calculated by the definition of Ashkin 3: 𝐹𝑐 𝑄𝑡𝑟 = 𝑛𝑃 (2) where c is the speed of light in vacuum, n is refractive index of medium, and P is the power of the trapping beam. Preparation of gold nanorods and two-photon excitation Gold nanorods were prepared following the reported synthesis technique5. The average length and the aspect ratio of gold nanorods are 45 nm and 4, respectively, corresponding to the longitudinal absorption at the wavelength of 800 nm. Gold nanorods were diluted by distilled water to different concentrations for tweezing. When the ultrashort pulsed beam with a central wavelength equal to the longitudinal absorption peak is used to tweeze gold nanorods, the strong photoluminescence is generated from the trapped nanorods. A plot of the photoluminescence intensity versus the incident power on a logarithmic scale fits a straight line with a slope close to two (Fig. S2a), indicating that the photoluminescence process is due to two-photon absorption2. Figure S1 (a) The dependence of the photoluminescence intensity (I) from trapped gold nanorods on the excitation power (Pout) on a log-log scale. (b) The dependence of the fluorescence intensity (If) from trapped fluorescent beads of diameter 5 μm on the excitation power (P) on a log-log scale. 2 Control and manipulation of dielectric and fluorescent micro-beads of diameter 25 m Randomly distributed dielectric micro-beads of 25 μm in diameters (Fig. S2a1) in water were moved one by one by optical endoscopy (Fig. S2a2 and S2a3 and positioned into a rectangular shape (Fig. S2a4) (also see the on-line movie Movie S5.mov). The tweezing of dielectric beads was caused by the gradient force generated from the focused laser beam of optical endoscopy. Similarly, Fig. S3b1-b4 reveal that randomly located fluorescent micro-beads of diameter 25 μm are tweezed by the trapping beam and precisely positioned in a vertical line. During the tweezing, a bright fluorescence spot from a trapped bead is observed as shown in Fig. S2b2 and S2b3 (also seen in the on-line movie Movie S6.mov). The measured fluorescent intensity as a function of the incident power fits a straight line on a logarithmic scale with a gradient close to 2, confirming that the generation of the fluorescence during the trapping is caused by two-photon absorption. Figure S2 (a)-(a4) Optical endoscopic tweezers of dielectric micro-beads of 25 μm immersed in water with the trapping power of 8.4 mW. (b1)-(b4) Optical nonlinear endoscopic tweezers (ONET) of fluorescent micro-beads of 25 μm immersed in water with the trapping power of 8.4 mW. Throughout this paper, the focal spot of the trapping laser beam is coloured in red and the two-photon fluorescence signal is coloured in green. Solid arrows point to the location of the trapping beam, while dashed ones illustrate the moving paths of the trapping beam. 3 Control and manipulation of multiple-fluorescent nano-beads of diameter 100 nm Fig. S3a1-a4 show that trapping of randomly distributed fluorescent nano-beads of 100 nm. When the trapping beam moves and encounters a nano-bead, the bead is then pushed to the beam. Further analysis demonstrates the fluorescent nano-beads are trapped at the dark ring of the Airy spot as shown in Fig. 3sa2. The dashed circle illustrates the first dark ring of the Airy spot determined by the Airy function. As the focal spot moves (Fig. S3a3), the trapped nano-beads are dragged by the trapping beam and more fluorescent nano-beads are trapped at the dark ring (Fig. S3a3 and S3a4) (on-line movie Movie S7.mov). Figure S3 ONET for trapping multiple nano-beads of diameter 100 nm with the trapping power of 8.4 mW. (a1) The focal spot moves towards one fluorescent nano-bead. (a2) One fluorescent nano- bead is trapped at the dark ring of the focal spot. The trapped bead is dragged by the trapping beam moving toward another nano-bead. (a3) Two fluorescent nano-beads are trapped in the dark ring. (a4) Three fluorescent nano-beads are trapped in the dark ring. The inset in Fig. S3a4 shows the three fluorescent nano-beads at the dark ring of the focal spot when the trapping beam is turned off. The dashed circles show the first dark ring of the focal spot. 4 Control and manipulation of multiple gold nanorods Figure 4s shows that randomly distributed gold nanorods were trapped at the first dark ring of the focal spot (Fig. S4a1) and moved with the movement of the focal spot (on-line movie Movie S8.mov). As the trapping laser beam is switched off, all the trapped gold nanorods located at the dark ring of the focal spot can be clearly seen (Fig. S4a2). Figure S4 ONET for trapping multiple nanorods. (a1) Multiple nanorods are trapped at the dark ring of the focal spot, shown as a dashed circle. (a2) When the trapping beam is switched off, the trapped gold nanorods are clearly seen within the dark ring of the focal spot of the trapping beam. Finite-difference time-domain simulation for surface plasmon resonance, opto-thermal force on nanorods and the snowball effect Finite-difference time-domain (FDTD) software from Lumerical was used to calculate the electric field enhancement surrounding a gold nanorod at its longitudinal resonance wavelength. A transverse magnetic (TM) polarised plane wave source with a wavelength range from 600 to 1200 nm was incident upon a 4 aspect ratio gold nanorod immersed in water. Optical constants for gold were taken from Johnson and Christy5 and water from Palik6,7. The resultant electric field intensity was measured surrounding the particle at its resonance wavelength of 800 nm. The maximum enhancement observed for the electric field was 3445 located at the ends of the rod. The FDTD simulation was generalised to include the thermal conversion and the conduction process in water. This physical process was modelled by the Green’s function approach8. The N temperature increase at position r in the medium can be obtained by T (r) G(r, ri )Qi , where i 1 5 G(r, ri ) is the Green’s function in the system and Qi is the heat power determined by the enhanced electric field generated by the i-th nanorod at position ri [8]. The net opto-thermal force f acting on the nanorods due to the present of the temperature gradient T can be approximated as9 f ST T , where ST is the Soret coefficient, 1 kBT , kB is the Boltzmann constant, T is temperature10. Fig. S5 illustrates the temperature increase in the surroundings for different numbers of nanorods trapped by the laser beam. The temperature increase T in the surroundings is less than 10 K while only a few nanorods are trapped by the laser beam, e.g. N < 20 (Fig. S5a and S5b). However, the gold nanorods in the focal region act as heat sources that produce a significant temperature gradient field in the surrounding medium. Fig. S6 illustrates the temperature gradient ∇T for different numbers of nanorods trapped. The opto-thermal force, which is approximately proportional to the temperature gradient ∇ T, becomes increasingly strong with increasing the number of nanorods trapped in the focal region. Figure S5 Temperature increase T for different numbers of nanorods trapped around the focal region. 6 Figure S6 Temperature gradient ∇𝑇 for different numbers of nanorods trapped around the focal region. Colour bars are in unit of K/m. Photothermal treatment on an individual cancer cell using the snowball effect To demonstrate the photothermal treatment on an individual cancer cell using the snowball effect in ONET, we used live gastric cancer cells (AGS) in RPMI-1640 medium (Sigma-Aldrich Pty. Ltd.) mixed with 10% Fetal Bovine Serum (Sigma-Aldrich Pty. Ltd.) and directly upload gold nanorods into the AGS cells through the snowball effect shown in Fig. S3b1-b4. Fig. S7a1-a3 shows that a targeted gastric cancer cell could be trapped and manipulated by ONET and that the trapped cell could not be damaged since not enough gold nanorods were uploaded to the cancer cells. After 6 seconds, several gold nanorods were pulled from the medium toward the trapped cancer cell. Fig. S7b1 and S7b2 show that gold nanorods dispersed in the medium move towards the trapped cell. In about 1 minute, approximate 400 gold nanorods were trapped into the cancer cell which is consequently damaged by the photothermal effect from the two-photon absorption of gold nanorods (Fig. S7b3 and the on-line movie Movie S9.mov). This result increases the specificity in cancer photothermal therapy, reduces the time of uploading gold nanorods to individual cancer cells by two orders of magnitude compared with the previous method11. 7 Figure S7 (a1)-(a3) An AGS cell immersed in the medium is trapped and manipulated by ONET. The trapping power was 10 mW. The trapping beam moves towards a cell at right side of the image (a1) and the cell is dragged by the beam towards the left side of the image (a2) and (a3). The dashed arrows show the moving trace of the beam. (b1)-(b3) Gastric cancer cell treatment using ONET when gold nanorods of concentration 104 per nano-litre were added to the solution. (b1) and (b2) display gold nanorods moving toward the trapping beam, where the short arrows point to the gold nanorods that start to move. (b3) As the number the trapped gold nanorods reaches 400 in the focal spot, cells were burned by the increasing heating effect generated through the two-photon absorption of gold nanorods. AGS gastric cancer cells were colored in cyan. 8 References 1. Bao H., J. Allen, R. Pattie, R. Vance & M. Gu, A fast handhold two-photon fluorescence microendoscope with a 475µm×475µm field of view for in vivo imaging. Opt. Lett. 33, 1333-1335 (2008). 2. Gu M., Bao H. & Li J. L., Cancer-cell microsurgery using nonlinear optical endomicroscopy. J. Biomed. Opt. 15, 050502-1-3 (2010). 3. Ashkin A., Forces of a single-beam gradient laser trap on a dielectric sphere in the ray optics regime. Biophys. J. 61, 569-582 (1992). 4. Kawauchi H., Yonezawa K., Kozawa Y. & Sato S., Calculation of optical trapping forces on a dielectric sphere in the ray optics regime produced by a radially polarized laser beam. Opt. Lett. 32, 1839-1841 (2007). 5. Sau T. K. & Murphy C. J., Seeded high yield synthesis of short Au nanorods in aqueous solution. Langmuir 20, 6414-6420 (2004). 6. Johnson P. B. & Christy R. W., Optical constants of the noble metals. Phys. Rev. B 6, 4370-4379 (1972). 7. Palik E. D., Handbook of Optical Constants of Solids, (Elsevier, Academic Press, San Diego, 1998). 8. Baffou G., Quidant R., & Girard C., Thermoplasmonics modeling: A Green’s function approach. Phys. Rev. B 82, 165424 (2010). 9. Piazza R. & Parola A., Thermophoresis in colloidal suspensions. J. Phys: Condens. Matter 20, 153102 (2008). 10. Wu J. & Gan X., Three dimensional nanoparticle trapping enhanced by surface plasmon resonance. Opt. Express 18, 27619-27626 (2010). 11. Li J. L., Day D. & Gu M., Ultra-low energy threshold for cancer photothermal therapy using transferrin-conjugated cold nanorods. Adv. Mater.20, 3866-3871 (2008). 9
