Supplemental Tables
advertisement

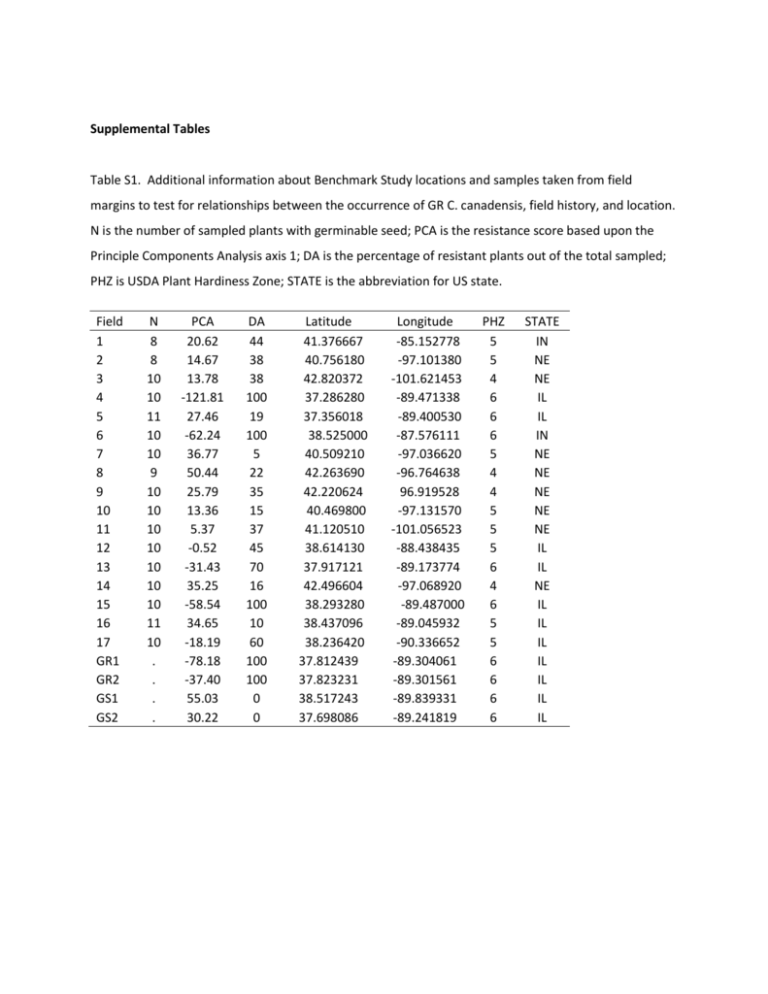
Supplemental Tables Table S1. Additional information about Benchmark Study locations and samples taken from field margins to test for relationships between the occurrence of GR C. canadensis, field history, and location. N is the number of sampled plants with germinable seed; PCA is the resistance score based upon the Principle Components Analysis axis 1; DA is the percentage of resistant plants out of the total sampled; PHZ is USDA Plant Hardiness Zone; STATE is the abbreviation for US state. Field 1 2 3 4 5 6 7 8 9 10 11 12 13 14 15 16 17 GR1 GR2 GS1 GS2 N 8 8 10 10 11 10 10 9 10 10 10 10 10 10 10 11 10 . . . . PCA 20.62 14.67 13.78 -121.81 27.46 -62.24 36.77 50.44 25.79 13.36 5.37 -0.52 -31.43 35.25 -58.54 34.65 -18.19 -78.18 -37.40 55.03 30.22 DA 44 38 38 100 19 100 5 22 35 15 37 45 70 16 100 10 60 100 100 0 0 Latitude 41.376667 40.756180 42.820372 37.286280 37.356018 38.525000 40.509210 42.263690 42.220624 40.469800 41.120510 38.614130 37.917121 42.496604 38.293280 38.437096 38.236420 37.812439 37.823231 38.517243 37.698086 Longitude -85.152778 -97.101380 -101.621453 -89.471338 -89.400530 -87.576111 -97.036620 -96.764638 96.919528 -97.131570 -101.056523 -88.438435 -89.173774 -97.068920 -89.487000 -89.045932 -90.336652 -89.304061 -89.301561 -89.839331 -89.241819 PHZ 5 5 4 6 6 6 5 4 4 5 5 5 6 4 6 5 5 6 6 6 6 STATE IN NE NE IL IL IN NE NE NE NE NE IL IL NE IL IL IL IL IL IL IL Table S2. Descriptive statistics for independent variables, Principal Component Analysis (PCA) axis 1 scores and Discriminant Analysis (DA) percentage of glyphosate-resistant (GR) C. canadensis plants in field margins, and environmental variables associated with field sites (n=17). Minimum Independent variables PCA axis 1 scoresa DA percent resistance Local effects Latitude Longitude USDA plant hardiness zones Management practices Crop rotation GR trait rotation Tillage 2006 2007 2008 Herbicide diversity Grower managed (AG1) field half 2006 2007 2008 a Descriptive Statistics Maximum Mean or % SE -121.81 0.10 50.44 1.00 -0.86 0.46 10.89 0.08 37.28628 -101.621 4 42.82037 -85.1528 6 39.92347 -93.1049 5.117 0.468 1.246 0.189 0 - no 0 - no 1 - yes 1 - yes 65% - yes 35% - yes - 0 - no 0 - no 0 - no 1 - yes 1 - yes 1 - yes 18% - yes 29% - yes 12% - yes - 0 - low 0 - low 0 - low 1 - high 1 - high 1 - high 24% - high 53% - high 53% - high - Abbreviations: PCA, principle component analysis, was performed on the variables by mother plant, using a variance covariance cross-products matrix, and each mother plant was assigned a score for axis loadings within the PCA. Mother plant scores were averaged by field and these were used as dependent variables for further analyses; DA, discriminant analysis, is a type of canonical variates analysis, where a set of linear functions of the predictor variables is constructed and used to classify unknown samples. Two GR and two GS C. canadensis populations were used as the reference set, and the classification variable selected was the visual rating at 14 DAT for the 1X rate. This variable had a high component loading for PCA axis 1 and was indicated as a significant predictor of glyphosate resistance for runs 1 and 2 in the DA; USDA, United States Department of Agriculture; GR, glyphosate-resistant; GS, glyphosatesusceptible; SE, standard error. Table S3. Summary of correlation and mixed model analyses of independent variables as related to Principal Component Analysis (PCA) axis 1 scores and Discriminant Analysis (DA) percentage of glyphosate-resistant (GR) C. canadensis plants in field margins. Significance is indicated by *P<0.05, **P<0.01 and ***P<0.001. Measures of glyphosate-resistant C. canadensis in field margins a Test type PCA scoresb DA % resistance Local effects Latitude R17= Longitude R17= USDA plant hardiness zones F2, 14= Management practices Crop rotation F1, 15= GR trait rotation F1, 15= Crop type 2006 F1, 15= 2007 F1, 15= 2008 F1, 15= Tillage 2006 F1, 15= 2007 F1, 15= 2008 F1, 15= Herbicide diversity Grower managed (AG1) field half 2006 F1,15= 2007 F1,15= 2008 F1,14= a 0.62 ** -0.44 8.65 ** -0.45 0.38 6.37 ** 1.05 0.62 0.27 3.05 3.08 0.04 3.08 3.10 1.65 3.10 0.08 6.06 * 0.60 1.75 7.16 * 2.56 0.43 5.67 * 1.68 0.14 7.13 * 0.24 Test type: The values indicated represent a Pearson correlation coefficient, R, with number of samples, or an F-statistic, with numerator and denominator degrees of freedom. b Abbreviations: PCA, principle component analysis, was performed on the variables by mother plant, using a variance covariance cross-products matrix, and each mother plant was assigned a score for axis loadings within the PCA. Mother plant scores were averaged by field and these were used as dependent variables for further analyses; DA, discriminant analysis, is a type of canonical variates analysis, where a set of linear functions of the predictor variables is constructed and used to classify unknown samples. Two GR and two GS C. canadensis populations were used as the reference set, and the classification variable selected was the visual rating at 14 DAT for the 1X rate. This variable had a high component loading for PCA axis 1 and was indicated as a significant predictor of glyphosate resistance for runs 1 and 2 in the DA; USDA, United States Department of Agriculture; GR, glyphosate-resistant; GS, glyphosatesusceptible. Table S4. General linear mixed model analyses, testing measures of reproductive output by population in the agrestal and ruderal habitats. Num, Den df = numerator degrees of freedom and denominator degrees of freedom, respectively. Agrestal habitat Num, Den df Ruderal habitat F P 9.30 0.0002 3,23 9.13 3,22 1.58 Num, Den df F P 3,8 0.42 0.74 0.0004 3,8 0.70 0.58 0.22 3,7 1.40 0.31 a) Number of capitulae per plant Population 3,26 b) Number of seed per capitulum Population c) Weight per seed Population Supplemental Figures 60 40 PCA Axis 1 Score 20 0 -20 -40 -60 -80 -100 R17=0.62, p=0.008 -120 -140 37 38 39 40 41 42 43 44 Latitude (°N) Figure S1. Correlation analysis of principle component analysis (PCA) axis 1 scores of GR C. canadensis in 2008 field margins by field with latitude, where the most negative scores are correlated with lower latitudes, indicating greater and more variable occurrence of resistance at lower latitudes. Percentage of flowering individuals 25 Agrestal Ruderal 20 15 10 5 0 GR1 GR2 GS1 GS2 Population Figure S2. Percentage of individuals reaching the flowering stage by population and habitat, based on survivorship curve data for flowering stage. Abbreviations labeling the x-axis indicate plants from the four populations: GR1 – GR population 1, GR2 – GR population 2, GS1 – GS population 1, GS2 – GS population 2. Maximum percentage of herbivory 60 a 50 40 ab b ab 30 20 10 0 GR1 GR2 GS1 GS2 Population Figure S3. Maximum estimate of herbivory (percentage of leaves damaged / individual) for individuals in the ruderal habitat. Mean values with the same letter are not significantly different (α = 0.05). Abbreviations labeling the x-axis indicate plants from the four populations: GR1 – GR population 1, GR2 – GR population 2, GS1 – GS population 1, GS2 – GS population 2.


