Electronic Supplementary Material Definitions Clonal Structure
advertisement
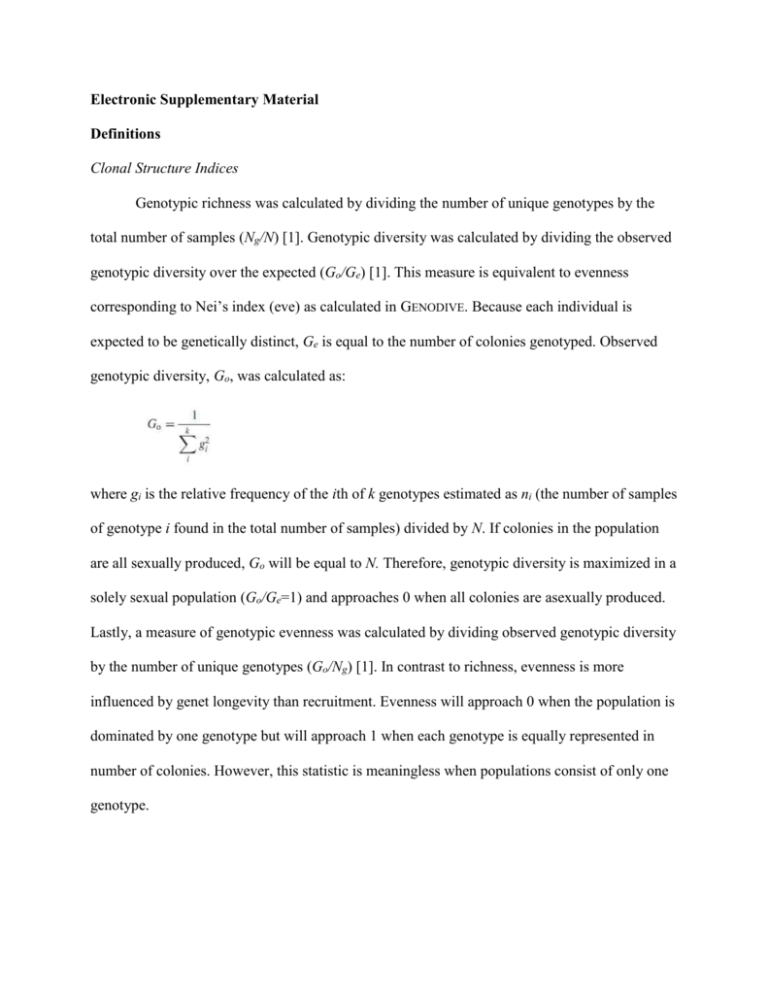
Electronic Supplementary Material Definitions Clonal Structure Indices Genotypic richness was calculated by dividing the number of unique genotypes by the total number of samples (Ng/N) [1]. Genotypic diversity was calculated by dividing the observed genotypic diversity over the expected (Go/Ge) [1]. This measure is equivalent to evenness corresponding to Nei’s index (eve) as calculated in GENODIVE. Because each individual is expected to be genetically distinct, Ge is equal to the number of colonies genotyped. Observed genotypic diversity, Go, was calculated as: where gi is the relative frequency of the ith of k genotypes estimated as ni (the number of samples of genotype i found in the total number of samples) divided by N. If colonies in the population are all sexually produced, Go will be equal to N. Therefore, genotypic diversity is maximized in a solely sexual population (Go/Ge=1) and approaches 0 when all colonies are asexually produced. Lastly, a measure of genotypic evenness was calculated by dividing observed genotypic diversity by the number of unique genotypes (Go/Ng) [1]. In contrast to richness, evenness is more influenced by genet longevity than recruitment. Evenness will approach 0 when the population is dominated by one genotype but will approach 1 when each genotype is equally represented in number of colonies. However, this statistic is meaningless when populations consist of only one genotype. Supplemental Results Clustering Results The first three principal coordinates explained >80% of the variation. The first principal component captured the differentiation between the two Porites species, explaining > 60% of the variation (Fig. 1A). STRUCTURE HARVESTER supported K = 2 as the most likely number of clusters. Support for K = 2 clusters was strong; adding a second cluster to the STRUCTURE analysis resulted in a 26% increase in likelihood from assuming just one cluster, while further increases in the number of clusters resulted in <2% increases in likelihood using this marker set. Genotyping results Strong clustering of MLGs into two groups in the PCA and STRUCTURE analysis can be attributed to the presence of fixed alleles at three loci and low allelic diversity in P. evermanni. (Fig. S1). Rarefied allelic richness estimates based on a standardized sample size (n=15) resulted in a mean number of alleles per locus per sampling location of 4.07±0.23 s.d. alleles in P. lobata and 2.40±0.17 s.d. alleles in P. evermanni. These differences in allelic diversity between species are likely due to ascertainment bias rather than biology because the markers were developed to be highly variable in P. lobata [2, 3]. Species distributions No difference was found in the number of colonies sampled per plot per region (ANOVA, square root transformed, df = 2, F = 0.574, p = 0.5; post-hoc pairwise tests (Tukey), p > 0.5 for all comparisons) or in the area sampled (standardized by design). The proportion of P. evermanni differed among all regions tested (ANOVA, arcsine square root transformed, df = 2, F = 73.383, p<0.001; post-hoc pairwise tests (Tukey), p < 0.005 for all comparisons; Fishers exact tests, Bonferonni correction, p<0.001). Mainland Costa Rica had the highest proportion of P. evermanni, followed by the coastal island and then the oceanic island where P. evermanni was nearly absent (Fig. 3). Supplementary References 1. Stoddart J.A. 1983 A genotypic diversity measure. J. Hered. 74, 489-490. 2. Polato N.R., Concepcion G.T., Toonen R.J., Baums I.B. 2010 Isolation by distance across the Hawaiian Archipelago in the reef-building coral Porites lobata. Mol. Ecol. 19, 4661-4677. (doi:10.1111/j.1365294X.2010.04836.x). 3. Baums I.B., Boulay J.N., Polato N.R., Hellberg M. 2012 No gene flow across the Eastern Pacific Barrier in the reef-building coral Porites lobata. Mol. Ecol. 21, 5418-5433. (doi:doi: 10.1111/j.1365-294X.2012.05733.x). Figure S1. Allele frequencies for Porites lobata (Pl) and Porites evermanni (Pe) at 11 microsatellite loci. Circles represent the presence of an allele and are scaled by the frequency of that allele in the data set. Allele size (bp) is given on the x axis. Species are given on the y axis. Figure S2. Denaturing gradient gel electrophoresis (DGGE) gel image. Symbiodinium ITS2 sequences from eight representative Porites evermanni (left) and eight Porites lobata samples (right) were run on a denaturing gradient gel with a ladder and two C15 positive controls (+). All samples show subclade C15 as their dominant symbiont as evident by the bands to the left of the arrow. * indicates that the band to the left was excised, re-amplifed, and Sanger sequenced. All sequences aligned with 100% identity with a published C15 ITS2 sequence (GenBank AY 239369.1). Table S1. Porites lobata (Pl) and Porites evermanni (Pe) samples (n = 684) were obtained from three regions (North, Central, and South) and 17 sites in the Eastern Tropical Pacific using haphazard (H) and/or random (R) sampling methods. Sites are arranged in approximately westto-east and north-to-south order. Given is the ratio of the number of unique multilocus genotypes by species (genets; NgPl, NgPe) over the total sample size (NPl, NPe). GPS locations are in decimal degrees (WGS84). The number of polar plots per site is given where applicable. See Table S3 for polar plot level information. Region Subregion Site Site Name NgPl/NPl NgPe/NPe Latitude Longitude North Clipperton CL01 Clipperton 5/51 2/2 10.29989 -109.216 Sampling Method(s) H Mexico ME01 Ixtapa 0/0 3/17 17.65436 -101.6234 H Costa Rica CR01* San Juanillo Marino Ballena Manuel Antonio Caño Island 0/0 5/50 10.31117 -85.74408 H; R (n=1) 22/291 23/34 9.104583 -83.7068 H; R (n=1) 3/31 17/27 9.381867 -84.1438 H 60/791 24/43 8.71067 -83.8911 H; R (n=3) Central CR02* CR03* CR04* CR05* CR06* Panama† South † Galapagos 6/12 8.6713 -83.7267 29/30 1 43/61 8.727433 -83.3863 H; R (n=2) 1 1/1 5.534834 -87.0875 R (n=3) 9/11 7.8168 -81.75 H Cocos Island 53/56 PA01* N Panama2 13/131 PA02* 3 GA01 S Panama Darwin 4/4 1 7/7 8.63 -79.03 H 36/40 1 4/5 1.616525 -91.9733 H 1 GA02 Wolf 35/41 0/0 1.336935 -91.806 H GA03 Marchena Central Galapagos4 Espanola 24/361 0/0 0.318369 -90.4691 H 12/131 0/0 -0.72846 -90.059 H 0/0 4/10 -1.3501 -89.618 H 1/27 1.476383 -80.7937 H GA05* Total Gulfo Dulce 1/8 CR07* GA04 Ecuador Drake Bay 1 EC01 La Llorona 2/20 1 299/377 149/307 1 Samples from Baums et al. 2012 2 Uva, Coibita 3 Contadora, Saboga 4 Santiago, Baltra, Floreana *Note that site numbers differ from sites described in Baums et al. 2012 † Collection does not include samples from Forsman et al. 2009 Table S2. Microsatellite loci for Porites lobata (Pl) and Porites evermanni (Pe). The primer sequences are preceded by the name of the fluorescent dye used (6FAM, VIC, NED or PET; Applied Biosystems, CA). The type of repeat and the size of the polymerase chain reaction (PCR) product is given (in basepairs, bp). Loci were amplified in four multiplex and one singleplex reaction (Plex) using the annealing temperatures (Temp) indicated. Marker Name PL0072 PL0780* PL0905† PL1357* PL1370† PL1551* PL1556* PL1629* PL1868† PL2069* PL2258* Primer Sequence F: NED-CACGCCTTTCTATTACGTTGA R: CACCCTCTTACACTTCATTCATT F: VIC-GCCAGTAGGTGGATACACTGTT R: CAAGTACGTTGACGTCGTTG F: NED-GGTCCAAAGTCCACCATCA R: TGGTGGAAATAAGTGGTCGA F:PET- ATGTCCCTGAAACGGAAGTA R: GATGATGATGTTGTTGATGGTG F: PET-GCACTGTCTGTAACAAGCGAA R: CATATTGGAAGGAGGGCTC F: PET-TGTTTCTGAGTGGCTGTGCT R: GGTTGGAAAGGGTCCTTCAT F: PET-CGTTGACGTAACCTTCACCA R: CACAGGGTAACCTTCCTTGC F: 6FAM-CCTTGGTTAATTTGCCCTTG R: ACCAGTCCGGAGTCAAGCTA F: VIC-TAAGCCACAGCAGGTGTACG R: AAACGTTCCCTATCCCATCC F: PET-CGCAGTTCCTTTGATTTGGT R: GTTTCTTTAGCGGTTGATGGCTTGTTAC F: NED-ATTAGCGGATGAAGCGAAGA R: TCCAATGTAACGCCAAATCA * Polato et al. 2010 † Baums et al. 2012 Repeat Size (bp) Temp (°C) Plex (AACG)10 205-407 54 E (ATT)4 (GTT)7 136-163 52 A (ATC)9 ACC (ATC)9 126-183 52 A (ACC)7…(ATC) 4…(ACC)7 Pl: 252-300 Pe: 100-111 52 D (GTT)8 189-246 54 E (GTT)8 178-196 52 A (ATC)10 153-168 56 B (GCT)8 168-180 52 D (AAC)10 Pl: 185-206 Pe: 179 52 D (GTT)8 Pl:249-267 Pe: 264 52 C (GAT)10 217-250 56 B Table S3. Indices of clonal structure as calculated for each polar plot. Colony sizes were estimated as maximum length multiplied by maximum width from measurements taken in the field. Go = same as Ne, Ge = N. The average number of ramets (R) over the number of genets (G) is given as well as average colony size. Species Site P. evermanni Caño Island Marino Ballena San Juanillo Gulfo Dulce Cocos Island N Ng Ng/N Go Go/Ge Go/Ng R/G Size (m2) ± s.d. Caño1 12 4 0.33 1.71 0.14 0.43 3.0 0.9±1.2 Caño2 10 5 0.50 2.50 0.25 0.50 2.0 0.3±0.3 Caño5 Tres Hermanas Punta Pleito Aguja 9 4 0.44 3.00 0.33 0.75 2.25 2.9±2.5 10 4 0.40 2.38 0.24 0.60 2.5 1.3±2.6 27 5 0.19 1.48 0.05 0.30 5.4 1.1±3.9 25 17 0.68 11.79 0.47 0.69 1.47 0.3±0.5 25 19 0.76 16.03 0.64 0.84 1.32 0.3±0.3 1 1 1.00 1.00 1.00 1.00 1.0 - Plot Sandalo *Punta Ulloa Total 118 58 0.49 38.90 0.33 0.67 2.0 0.8±2.2 Mean* 16.85 8.29 0.47 5.56 0.30 0.59 2.6 1.0 s.d. 8.32 6.68 0.20 5.86 0.20 0.19 1.3 1.4 Caño1 8 8 1.00 8.00 1.00 1.00 1.0 1.2±1.1 Caño2 10 5 0.50 3.57 0.36 0.71 2.0 0.2±0.2 Caño5 Tres Hermanas Punta Ulloa Bahia Weston Punta Maria 11 9 0.82 8.07 0.73 0.90 1.2 1.4±1.5 4 2 0.50 1.60 0.40 0.80 2.0 0.2±0.2 17 16 0.94 15.21 0.89 0.95 1.1 0.1±0.3 20 18 0.90 16.67 0.83 0.93 1.1 0.7±0.8 20 20 1.00 20.00 1.00 1.00 1.0 0.9±1.0 Total 90 78 0.87 73.12 0.81 0.94 1.15 0.7±1.0 Mean 12.85 11.14 0.81 10.45 0.75 0.90 1.3 0.7 s.d. 6.23 6.89 0.22 6.95 0.27 0.11 0.5 0.5 P. lobata Caño Island Marino Ballena Cocos Island * P. evermanni means exclude Punta Ulloa
