Mehlis M *, Rick IP, Bakker TCM 2015 Dynamic resource allocation
advertisement
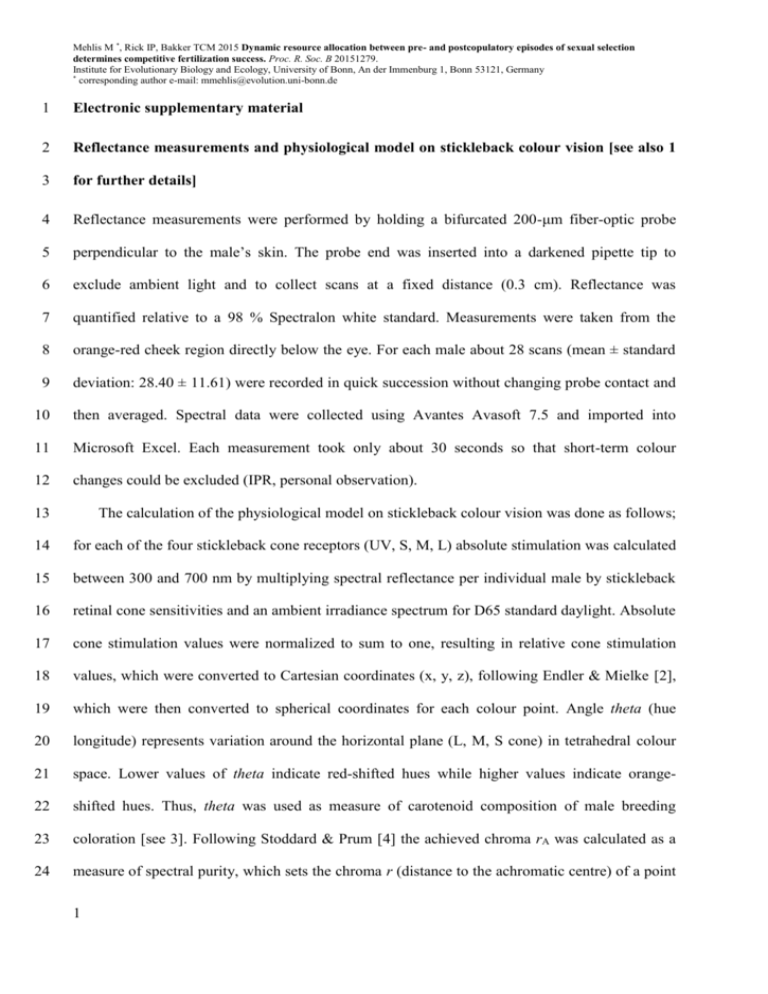
Mehlis M *, Rick IP, Bakker TCM 2015 Dynamic resource allocation between pre- and postcopulatory episodes of sexual selection determines competitive fertilization success. Proc. R. Soc. B 20151279. Institute for Evolutionary Biology and Ecology, University of Bonn, An der Immenburg 1, Bonn 53121, Germany * corresponding author e-mail: mmehlis@evolution.uni-bonn.de 1 Electronic supplementary material 2 Reflectance measurements and physiological model on stickleback colour vision [see also 1 3 for further details] 4 Reflectance measurements were performed by holding a bifurcated 200-μm fiber-optic probe 5 perpendicular to the male’s skin. The probe end was inserted into a darkened pipette tip to 6 exclude ambient light and to collect scans at a fixed distance (0.3 cm). Reflectance was 7 quantified relative to a 98 % Spectralon white standard. Measurements were taken from the 8 orange-red cheek region directly below the eye. For each male about 28 scans (mean ± standard 9 deviation: 28.40 ± 11.61) were recorded in quick succession without changing probe contact and 10 then averaged. Spectral data were collected using Avantes Avasoft 7.5 and imported into 11 Microsoft Excel. Each measurement took only about 30 seconds so that short-term colour 12 changes could be excluded (IPR, personal observation). 13 The calculation of the physiological model on stickleback colour vision was done as follows; 14 for each of the four stickleback cone receptors (UV, S, M, L) absolute stimulation was calculated 15 between 300 and 700 nm by multiplying spectral reflectance per individual male by stickleback 16 retinal cone sensitivities and an ambient irradiance spectrum for D65 standard daylight. Absolute 17 cone stimulation values were normalized to sum to one, resulting in relative cone stimulation 18 values, which were converted to Cartesian coordinates (x, y, z), following Endler & Mielke [2], 19 which were then converted to spherical coordinates for each colour point. Angle theta (hue 20 longitude) represents variation around the horizontal plane (L, M, S cone) in tetrahedral colour 21 space. Lower values of theta indicate red-shifted hues while higher values indicate orange- 22 shifted hues. Thus, theta was used as measure of carotenoid composition of male breeding 23 coloration [see 3]. Following Stoddard & Prum [4] the achieved chroma rA was calculated as a 24 measure of spectral purity, which sets the chroma r (distance to the achromatic centre) of a point 1 Mehlis M *, Rick IP, Bakker TCM 2015 Dynamic resource allocation between pre- and postcopulatory episodes of sexual selection determines competitive fertilization success. Proc. R. Soc. B 20151279. Institute for Evolutionary Biology and Ecology, University of Bonn, An der Immenburg 1, Bonn 53121, Germany * corresponding author e-mail: mmehlis@evolution.uni-bonn.de 25 in colour space in relation to the potential maximum chroma rmax for its hue (rA = r/rmax) using 26 the pavo package in R (version 3.0.2) [5]. The magnitude of rA was used as an estimate of the 27 concentration of carotenoids allocated to a male’s breeding signal with higher values describing 28 a more saturated coloration. Angle phi (hue latitude), which represents variation around the 29 vertical plane of the colour space (stimulation of the UV cone) was not considered in the present 30 study as we were only interested in analysing variation in the composition (theta) and 31 concentration (rA) of carotenoids in male breeding coloration [see 3]. 2 Mehlis M *, Rick IP, Bakker TCM 2015 Dynamic resource allocation between pre- and postcopulatory episodes of sexual selection determines competitive fertilization success. Proc. R. Soc. B 20151279. Institute for Evolutionary Biology and Ecology, University of Bonn, An der Immenburg 1, Bonn 53121, Germany * corresponding author e-mail: mmehlis@evolution.uni-bonn.de 32 Quantification of sperm swimming abilities (i.e. percentage of motile sperm, sperm velocity 33 and sperm linearity) 34 Prior to the quantification of sperm swimming abilities the pestled left testis was set at a constant 35 temperature (16 °C; Thriller, PEQLAB_V0410E, Erlangen, Germany). Exactly, two minutes 36 later a Leja counting chamber (depth 12 μm, Nieuw-Vennep, The Netherlands) was loaded with 37 3 μl of the mixed sperm suspension to achieve the following variables: (1) percentage of motile 38 sperm, (2) velocity curvilinear (VCL [μm s -1]), (3) velocity average path (VAP [μm s -1]), (4) 39 velocity straight line (VSL [μm s -1]), (5) straightness (STR=VSL/VAP × 100 [%]), (6) linearity 40 (LIN=VSL/VCL × 100 [%]) and (7) wobble (side to side movement of the sperm head; 41 WOB=VAP/VCL × 100 [%]). For each male subsequent data analyses were based on sperm 42 speed measurements of about hundred single sperm (mean ± SD: 126.26 ± 72.11). Threshold 43 values for excluding immotile sperm were specified as 10 μm s 44 and 2 μm s -1 for VSL [see also 6, 7]. To receive a single significant factor (Kaiser criterion > 1) 45 for sperm velocity (VCL, VAP and VCL) and sperm linearity (LIN, STR and WOB) principal 46 component analyses were conducted (see below, table S1). 3 -1 for VCL, 5 μm s -1 for VAP Mehlis M *, Rick IP, Bakker TCM 2015 Dynamic resource allocation between pre- and postcopulatory episodes of sexual selection determines competitive fertilization success. Proc. R. Soc. B 20151279. Institute for Evolutionary Biology and Ecology, University of Bonn, An der Immenburg 1, Bonn 53121, Germany * corresponding author e-mail: mmehlis@evolution.uni-bonn.de 47 table S1. Principal component analyses of measured sperm variables. 48 So far it is unknown which sperm swimming variables are the most relevant during sperm 49 competition in sticklebacks, thus principal component analyses were performed to obtain a single 50 significant factor (Kaiser criterion > 1) of sperm velocity (VCL, VAP and VCL) and sperm 51 linearity (LIN, STR and WOB) [see also 6, 7]. high-quantity/high-quality [+ +] high-quantity/low-quality [+ −] low-quantity/low-quality [− −] high-quantity/high-quality and low-quantity/low-quality ([+ +] and [− −]) high-quantity/high-quality and high-quantity/low-quality ([+ +] and [+ −]) high-quantity/low-quality and low-quantity/low-quality ([+ −] and [− −]) all three feeding treatments principal component PC1sperm velocity PC1sperm linearity PC1sperm velocity PC1sperm linearity PC1sperm velocity PC1sperm linearity PC1sperm velocity PC1sperm linearity PC1sperm velocity PC1sperm linearity PC1sperm velocity PC1sperm linearity PC1sperm velocity PC1sperm linearity Eigenvalue 1.654 1.556 1.643 1.484 1.646 1.577 1.663 1.523 1.648 1.554 1.655 1.510 1.659 1.526 proportion of variance 91.15 % 80.68 % 89.99 % 73.38 % 90.31 % 82.94 % 92.21 % 77.34 % 90.50 % 80.49 % 91.29 % 75.97 % 91.74 % 77.58 % 52 53 Principal component analyses were done separately (for each treatment, between the sub- 54 trials and across all three feeding treatments) as the PC1-values were included in several 55 different analyses as well (see main manuscript). Higher values for PC1 sperm velocity and PC1 56 sperm linearity indicated faster and sperm swimming with a more linear path, respectively. This 57 was true for each diet treatment separately (Pearson correlations: N = 21, all rP ≥ 0.616, all p ≤ 58 0.003), between the sub-trials (Pearson correlations: N = 42, all rP ≥ 0.689, all p < 0.001) and 59 across all treatments (Pearson correlations: N = 63, both rP ≥ 0.718, both p < 0.001). In two cases 60 (high-quantity/high-quality vs. high-quantity/low-quality, [+ +] vs. [+ −] and high-quantity/low- 61 quality [+ −]) VCL was logarithmically transformed to achieve normal distribution according to 62 Kolmogorov-Smirnov tests with Lilliefors correction. 63 4 Mehlis M *, Rick IP, Bakker TCM 2015 Dynamic resource allocation between pre- and postcopulatory episodes of sexual selection determines competitive fertilization success. Proc. R. Soc. B 20151279. Institute for Evolutionary Biology and Ecology, University of Bonn, An der Immenburg 1, Bonn 53121, Germany * corresponding author e-mail: mmehlis@evolution.uni-bonn.de 64 table S2. List of all nine microsatellite markers [8, 9] that were used for paternity analyses. Locus GenBank accession no. combined dye label tail tail-sequence 5'- 3‘ GAC1116PBBE AJ010353 mix X D3 (green) T7 TAATACGACTCACTATAG GAC7033PBBE AJ010360 mix X D4 (blue) M13 TGTAAAACGACGGCCAGT GAC3133PBBE AJ010356 mix Y D4 (blue) Sp6 GATTTAGGTGACACTAT GAC4174PBBE AJ010358 mix Y D3 (green) T7 TAATACGACTCACTATAG GAC7010PBBE AJ311863 mix Y D2 (black) M13 TGTAAAACGACGGCCAGT GAC1097PBBE AJ010352 mix Z D2 (black) M13 TGTAAAACGACGGCCAGT GAC1125PBBE AJ010354 mix Z D2 (black) M13 TGTAAAACGACGGCCAGT GAC4170PBBE AJ010357 mix Z D4 (blue) Sp6 GATTTAGGTGACACTAT GAC5196PBBE AJ010359 mix Z D3 (green) T7 TAATACGACTCACTATAG 65 66 Same letter mix (X, Y or Z) indicated that they were combined during PCR reaction [using 67 the tailed primer method; see 10] and genetic analyses (Beckman Coulter). All putative fathers 68 were full-sib brothers but they originated from a large anadromous and hence genetically 69 heterogeneous population [8]. Nevertheless, for each sub-trial it was separately decided which 70 mix (X, Y or Z, see also table S3) was used for egg-genotyping because in many cases some 71 microsatellite markers were not meaningful (i.e. 100 % informative). On average, each egg was 72 successfully genotyped with 3.49 ± 1.44 (mean ± standard deviation (SD)) microsatellites 73 markers of which at least one (1.63 ± 0.70; mean ± SD) was 100 % informative. 74 For each sub-trial [+ +] vs. [− −], [+ +] vs. [+ −] or [+ −] vs. [− −], 30 randomly chosen eggs 75 were extracted and genotyped, apart from five exceptions; in four sub-trials less than 30 eggs had 76 been fertilized and in one case there was a miscount leading to the analysis of 31 eggs. Thus, the 77 total sample size constitutes 1826 eggs, of which 1718 eggs could be successfully assigned to 78 one father (mean ± SD: 27.27 ± 4.87 eggs per sub-trial). In total, 108 eggs had to be discarded 79 due to contamination (49 eggs; more than 2 alleles), no available informative microsatellite 80 marker (54 eggs) or no successful fertilization (5 eggs; no ‘father-alleles’). 81 5 Mehlis M *, Rick IP, Bakker TCM 2015 Dynamic resource allocation between pre- and postcopulatory episodes of sexual selection determines competitive fertilization success. Proc. R. Soc. B 20151279. Institute for Evolutionary Biology and Ecology, University of Bonn, An der Immenburg 1, Bonn 53121, Germany * corresponding author e-mail: mmehlis@evolution.uni-bonn.de 82 table S3. Details of used PCR conditions. Primer mix X GAC1116PBBE GAC7033PBBE Primer mix Y GAC3133PBBE GAC4174PBBE GAC7010PBBE Primer mix Z GAC1097PBBE GAC1125PBBE GAC4170PBBE GAC5196PBBE reverse (10 pmol/µl) labeled (10 pmol/µl) forward (2.5 pmol/µl) reverse (10 pmol/µl) labeled (10 pmol/µl) forward (2.5 pmol/µl) Qiagen Multiplex PCR distilled water kit (extracted) DNA 1 x µl 0.400 0.400 0.200 0.100 0.100 0.050 5.000 2.000 2.000 PCR program mix X preheating 30 cycles denaturing annealing elongating 8 cycles denaturing annealing elongating final extension cycle reverse (10 pmol/µl) labeled (10 pmol/µl) forward (2.5 pmol/µl) reverse (10 pmol/µl) labeled (10 pmol/µl) forward (2.5 pmol/µl) reverse (10 pmol/µl) labeled (10 pmol/µl) forward (2.5 pmol/µl) Qiagen Multiplex PCR distilled water kit (extracted) DNA 1 x µl 0.100 0.100 0.050 0.200 0.200 0.100 0.160 0.160 0.080 5.000 1.850 2.000 PCR program mix Y preheating 30 cycles denaturing annealing elongating 8 cycles denaturing annealing elongating final extension cycle reverse (10 pmol/µl) labeled (10 pmol/µl) forward (2.5 pmol/µl) reverse (10 pmol/µl) labeled (10 pmol/µl) forward (2.5 pmol/µl) reverse (10 pmol/µl) labeled (10 pmol/µl) forward (2.5 pmol/µl) reverse (10 pmol/µl) labeled (10 pmol/µl) forward (2.5 pmol/µl) Qiagen Multiplex PCR distilled water kit (extracted) DNA 1 x µl 0.250 0.250 0.125 0.060 0.060 0.030 0.150 0.150 0.075 0.400 0.400 0.200 5.000 0.850 2.000 PCR program mix Z preheating 30 cycles denaturing annealing elongating 8 cycles denaturing annealing elongating final extension cycle 94°C 15 min. 94°C 60 sec. 56°C 45 sec. 72°C 60 sec. 94°C 60 sec. 53°C 45 sec. 72°C 60 sec. 72°C 30 min. 94°C 15 min. 94°C 60 sec. 56°C 45 sec. 72°C 60 sec. 94°C 60 sec. 53°C 45 sec. 72°C 60 sec. 72°C 30 min. 94°C 15 min. 94°C 60 sec. 58°C 45 sec. 72°C 60 sec. 94°C 60 sec. 53°C 45 sec. 72°C 60 sec. 72°C 30 min. 83 84 Each PCR product (10 µl) was diluted with 90 µl distilled water and 2 µl of this dilution 85 were mixed with 0.1 µl of GenomeLabTM DNA Size Standard 400 and 30 µl of GenomeLabTM 86 Sample Loading Solution (Beckman Coulter). Genotypes of all parents were scored on a CEQ 87 8800 Genetic Analysis System (Beckman Coulter) and analysed via GenomeLabTM GeXP 88 (version10.2). 89 6 Mehlis M *, Rick IP, Bakker TCM 2015 Dynamic resource allocation between pre- and postcopulatory episodes of sexual selection determines competitive fertilization success. Proc. R. Soc. B 20151279. Institute for Evolutionary Biology and Ecology, University of Bonn, An der Immenburg 1, Bonn 53121, Germany * corresponding author e-mail: mmehlis@evolution.uni-bonn.de 90 table S4. Overview of all fitted models (see main manuscript for further details). dependent variable body size [cm] (sub-adults and adults) body mass [g] (sub-adults and adults) mortality [%] theta (hue longitude) achieved chroma (rA) relative testis mass (GSI) absolute testis mass [g] sperm number motile sperm [%] sperm velocity sperm linearity paternity [%] mean fertilization success sperm velocity explanatory variable feeding treatment and sub-trial feeding treatment and sub-trial feeding treatment and sub-trial feeding treatment and sub-trial feeding treatment and sub-trial feeding treatment and sub-trial feeding treatment and sub-trial feeding treatment and sub-trial feeding treatment and sub-trial feeding treatment and sub-trial feeding treatment and sub-trial sub-trial feeding treatment x mean sperm velocity food restriction (yes/no) x achieved chroma (rA) random factor family family family family family family family family family family family family family family feeding treatment: [+ +] vs. [+ −] vs. [− −] sub-trial: [+ +] vs. [− −], [+ +] vs. [+ −] or [+ −] vs. [− −] food restriction (yes/no): [− −] vs. [+ +] and [+ −] calculation of mean fertilization success and mean sperm velocity: [((focal male – competitor 1) + (focal male – competitor 2))/2] x means interaction term 91 92 93 In all models family identity was included as random factor and never removed to control for genotype influences. 94 7 Mehlis M *, Rick IP, Bakker TCM 2015 Dynamic resource allocation between pre- and postcopulatory episodes of sexual selection determines competitive fertilization success. Proc. R. Soc. B 20151279. Institute for Evolutionary Biology and Ecology, University of Bonn, An der Immenburg 1, Bonn 53121, Germany * corresponding author e-mail: mmehlis@evolution.uni-bonn.de 95 table S5. Descriptive data (mean ± standard deviation (SD)) of all measured variables for high- 96 quantity/high-quality [+ +], high-quantity/low-quality [+ −] and low-quantity/low-quality [− −] 97 fed males. [+ +] sub-adult (~ 5 months) adult (~ 1 year old) development breeding coloration testes traits sperm traits body size [cm] body mass [g] body size [cm] body mass [g] mortality [%] * theta (hue longitude) achieved chroma (rA) relative testis mass (GSI) absolute testis mass [g] sperm number motile sperm [%] sperm velocity sperm linearity mean 3.21 0.393 4.76 1.355 8.25 0.293 0.716 0.674 0.0090 108.5 * 106 37.62 -0.639 -0.239 SD 0.21 0.070 0.22 0.220 5.34 0.109 0.030 0.168 0.0026 53.6 * 106 8.62 1.464 1.555 [+ −] mean 3.17 0.382 4.55 1.241 11.11 0.423 0.731 0.742 0.0091 126.5 * 106 37.94 -0.325 -0.126 SD 0.18 0.056 0.25 0.212 9.56 0.106 0.042 0.187 0.0024 49.0 * 106 9.06 1.367 1.500 [− −] mean 2.43 0.193 3.99 0.835 25.40 0.474 0.754 0.659 0.0053 59.4 * 106 36.44 0.964 0.365 SD 0.19 0.047 0.37 0.279 9.46 0.121 0.032 0.214 0.0020 20.3 * 106 7.32 1.733 1.526 * This equals an absolute number of on average 2.48 ± 1.60 [+ +], 3.33 ± 2.87 [+ −] and 7.62 ± 2.84 [− −] dead individuals over a period of about 9 months. 98 99 8 Mehlis M *, Rick IP, Bakker TCM 2015 Dynamic resource allocation between pre- and postcopulatory episodes of sexual selection determines competitive fertilization success. Proc. R. Soc. B 20151279. Institute for Evolutionary Biology and Ecology, University of Bonn, An der Immenburg 1, Bonn 53121, Germany * corresponding author e-mail: mmehlis@evolution.uni-bonn.de 100 table S6. Results of the statistical analyses of pre- and postcopulatory traits after removing the 4 101 least intensely coloured males out of each of the two diet groups [+ +] and [+ −] (N[+ +] = 17; 102 N[+ −] = 17; N[− −] = 21). pairwise comparison of the different sub-trials [+ +] vs. [− −] dependent variable breeding coloration theta (hue longitude) achieved chroma (rA) testes traits relative testis mass (GSI) absolute testis mass [g] sperm traits sperm number motile sperm [%] sperm velocity sperm linearity χ2 20.34 8.08 3.12 25.56 20.99 5.48 8.97 1.05 p-value <0.001 0.018 0.211 <0.001 <0.001 0.064 0.011 0.592 χ2 27.92 8.85 <0.01 17.98 11.68 2.00 6.46 0.74 p-value <0.001 0.003 0.940 <0.001 <0.001 0.158 0.011 0.390 [+ +] vs. [+ −] χ2 11.71 3.13 2.25 0.30 1.65 1.80 0.12 0.04 p-value <0.001 0.077 0.134 0.581 0.199 0.179 0.729 0.834 [+ −] vs. [− −] χ2 1.38 0.95 3.15 22.72 24.88 4.31 5.50 0.34 p-value 0.240 0.330 0.076 <0.001 <0.001 0.038 0.019 0.560 103 104 Analyses were performed following the same procedure as described for the main results. 105 After removal of the 4 least intensely colored males results were qualitatively the same (see also 106 Table 1 in the main manuscript) except the pairwise comparison of [+ −] vs [− −] with respect to 107 achieved chroma (rA) (p = 0.047 changed to p = 0.330) and percentage of motile sperm (p = 108 0.051 changed to p = 0.038). This rather conservative testing clearly shows that significant 109 selection due to higher mortality during development in the [− −] group relative to the males in 110 the other diet groups ([+ +] and [+ −]) cannot account for our main findings. 111 Accordingly, males from the daily-fed groups ([+ +] and [+ −]) developed a significant 112 positive relationship between achieved chroma (rA) and sperm velocity also for the reduced data 113 set (Spearman correlation: N = 34, rS = 0.348, p = 0.044). The significant interaction between 114 males from the three feeding treatments with regard to their investment in pre- and 115 postcopulatory traits also remained significant after data reduction (“lme”, N = 55, χ2 = 9.112, p 116 = 0.011; see also figure 3 in the main manuscript). 117 9 Mehlis M *, Rick IP, Bakker TCM 2015 Dynamic resource allocation between pre- and postcopulatory episodes of sexual selection determines competitive fertilization success. Proc. R. Soc. B 20151279. Institute for Evolutionary Biology and Ecology, University of Bonn, An der Immenburg 1, Bonn 53121, Germany * corresponding author e-mail: mmehlis@evolution.uni-bonn.de 118 References 119 1. 120 121 red sensitivity in sticklebacks. PLoS ONE 6, e25554. 2. 122 123 3. Pike TW, Bjerkeng B, Blount JB, Lindström J, Metcalfe NB. 2011 How integument colour reflects its carotenoid content: a stickleback's perspective. Funct. Ecol. 25, 297-304. 4. 126 127 Endler JA, Mielke PW. 2005 Comparing entire colour patterns as birds see them. Biol. J. Linn. Soc. 86, 405-431. 124 125 Rick IP, Mehlis M, Bakker TCM. 2011 Male red ornamentation is associated with female Stoddard MC, Prum RO. 2008 Evolution of avian plumage color in a tetrahedral color space: a phylogenetic analysis of new world buntings. Am. Nat. 171, 755-776. 5. Maia R, Eliason CM, Bitton P-P, Doucet SM, Shawkey MD. 2013 Pavo: an R package for 128 the analysis, visualization and organization of spectral data. Methods. Ecol. Evol. 4, 906- 129 913. 130 6. 131 132 Mehlis M, Hilke LK, Bakker TCM. 2013 Attractive males have faster sperm in threespined sticklebacks Gasterosteus aculeatus. Curr. Zool. 59, 761-768. 7. Rick IP, Mehlis M, Eßer E, Bakker TCM. 2014 The influence of ambient ultraviolet light 133 on sperm quality and sexual ornamentation in three-spined sticklebacks (Gasterosteus 134 aculeatus). Oecologia 174, 393-402. 135 8. Heckel G, Zbinden M, Mazzi D, Kohler A, Reckeweg G, Bakker TCM, Largiadèr CR. 136 2002 Microsatellite markers for the three-spined stickleback (Gasterosteus aculeatus L.) 137 and their applicability in a freshwater and an anadromous population. Conserv. Genet. 3, 138 79-81. 139 9. Largiadèr CR, Fries V, Kobler B, Bakker TCM. 1999 Isolation and characterization of 140 microsatellite loci from the three-spined stickleback (Gasterosteus aculeatus L.). Mol. 141 Ecol. 8, 342-344. 142 10. 143 Schuelke M. 2000 An economic method for the fluorescent labeling of PCR fragments. Nat. Biotechnol. 18, 233-234. 10
