Supplementary text
advertisement
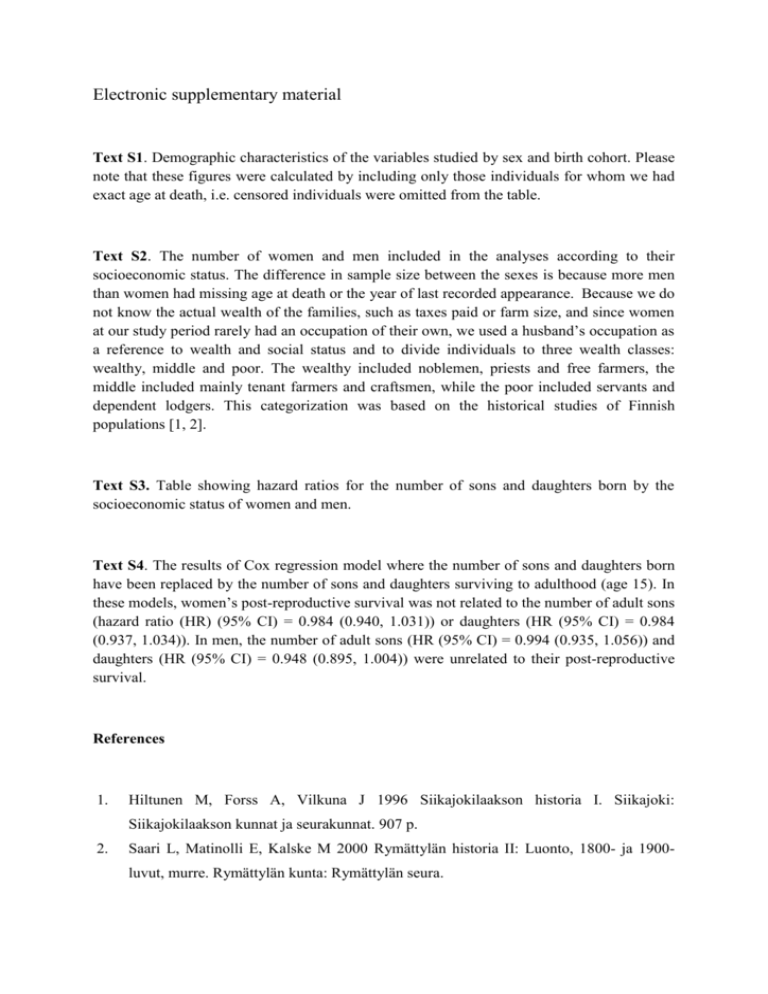
Electronic supplementary material Text S1. Demographic characteristics of the variables studied by sex and birth cohort. Please note that these figures were calculated by including only those individuals for whom we had exact age at death, i.e. censored individuals were omitted from the table. Text S2. The number of women and men included in the analyses according to their socioeconomic status. The difference in sample size between the sexes is because more men than women had missing age at death or the year of last recorded appearance. Because we do not know the actual wealth of the families, such as taxes paid or farm size, and since women at our study period rarely had an occupation of their own, we used a husband’s occupation as a reference to wealth and social status and to divide individuals to three wealth classes: wealthy, middle and poor. The wealthy included noblemen, priests and free farmers, the middle included mainly tenant farmers and craftsmen, while the poor included servants and dependent lodgers. This categorization was based on the historical studies of Finnish populations [1, 2]. Text S3. Table showing hazard ratios for the number of sons and daughters born by the socioeconomic status of women and men. Text S4. The results of Cox regression model where the number of sons and daughters born have been replaced by the number of sons and daughters surviving to adulthood (age 15). In these models, women’s post-reproductive survival was not related to the number of adult sons (hazard ratio (HR) (95% CI) = 0.984 (0.940, 1.031)) or daughters (HR (95% CI) = 0.984 (0.937, 1.034)). In men, the number of adult sons (HR (95% CI) = 0.994 (0.935, 1.056)) and daughters (HR (95% CI) = 0.948 (0.895, 1.004)) were unrelated to their post-reproductive survival. References 1. Hiltunen M, Forss A, Vilkuna J 1996 Siikajokilaakson historia I. Siikajoki: Siikajokilaakson kunnat ja seurakunnat. 907 p. 2. Saari L, Matinolli E, Kalske M 2000 Rymättylän historia II: Luonto, 1800- ja 1900luvut, murre. Rymättylän kunta: Rymättylän seura. Table S1. Demographic characteristics of the variables studied by sex and birth cohort. Life-history trait <1800 Post-reproductive lifespan (yr) Age at last reproduction (yr) Number of sons born Number of adult sons Number of daughters born Number of adult daughters 1800-1900 Post-reproductive lifespan (yr) Age at last reproduction (yr) Number of sons born Number of adult sons Number of daughters born Number of adult daughters >1900 Post-reproductive lifespan (yr) Age at last reproduction (yr) Number of sons born Number of adult sons Number of daughters born Number of adult daughters Women mean std Men mean std 25.43 38.04 2.69 1.65 2.53 1.64 13.70 5.77 1.99 1.38 1.87 1.38 20.07 40.07 2.48 1.56 2.43 1.60 14.07 8.09 1.99 1.34 1.96 1.39 24.69 36.78 2.58 1.61 2.43 1.56 16.31 6.49 1.90 1.52 1.80 1.47 18.75 40.11 2.71 1.66 2.56 1.58 15.14 8.43 1.94 1.55 1.93 1.52 29.60 31.97 1.65 1.39 1.42 1.25 18.92 6.25 1.38 1.29 1.24 1.19 24.90 35.41 1.66 1.44 1.50 1.29 16.16 6.70 1.43 1.30 1.45 1.40 Table S2. Number of women and men according to their socioeconomic status. Wealthy Middle Poor women 2720 4633 3813 men 1312 2579 2469 Table S3. Hazard ratios and 95% CIs for the number of sons and daughters born by women’s and men’s socioeconomic status. Socioeconomic status Wealthy Number of sons Number of daughters Middle Number of sons Number of daughters Poor Number of sons Number of daughters Women HR (95% CI) Men HR (95% CI) 1.07 (1.03, 1.12) 1.02 (0.98, 1.06) 1.01 (0.96, 1.06) 0.98 (0.93, 1.02) 1.05 (1.01, 1.09) 1.04 (1.01, 1.07) 1.01 (0.96, 1.06) 1.01 (0.98, 1.04) 1.06 (1.03, 1.10) 1.02 (0.99, 1.05) 1.01 (0.96, 1.06) 1.01 (0.98, 1.03) Table S4. Cox regression model on the association between post-reproductive survival and the number of adult sons and daughters in Finnish women and men. In women, the influences of age at last reproduction, socio-economic status and birth area were time-dependent (Wald χ21 > 7.69, p < 0.056), whereas in men, the influences of age at last reproduction and birth area were time-dependent (Wald χ21 > 6.22, p < 0.013). Number of sons (NS) Number of daughters (ND) Age at last reproduction Socio-economic status (SES) Birth cohort Birth area Twinning status NS × SES ND × SES df 1 1 1 2 2 4 1 2 2 Women Wald χ2 0.44 0.40 64.5 9.95 636.7 160.3 0.89 0.26 3.74 Men p 0.51 0.53 <0.0001 0.007 <0.0001 <0.0001 0.35 0.88 0.15 Wald χ 0.04 3.34 9.27 6.83 276.0 113.1 0.28 1.92 2 p 0.84 0.068 0.002 0.033 <0.0001 <0.0001 0.87 0.38
