Quiz 1 & 2 Review Practice 1. Which graph is shows a proportional
advertisement
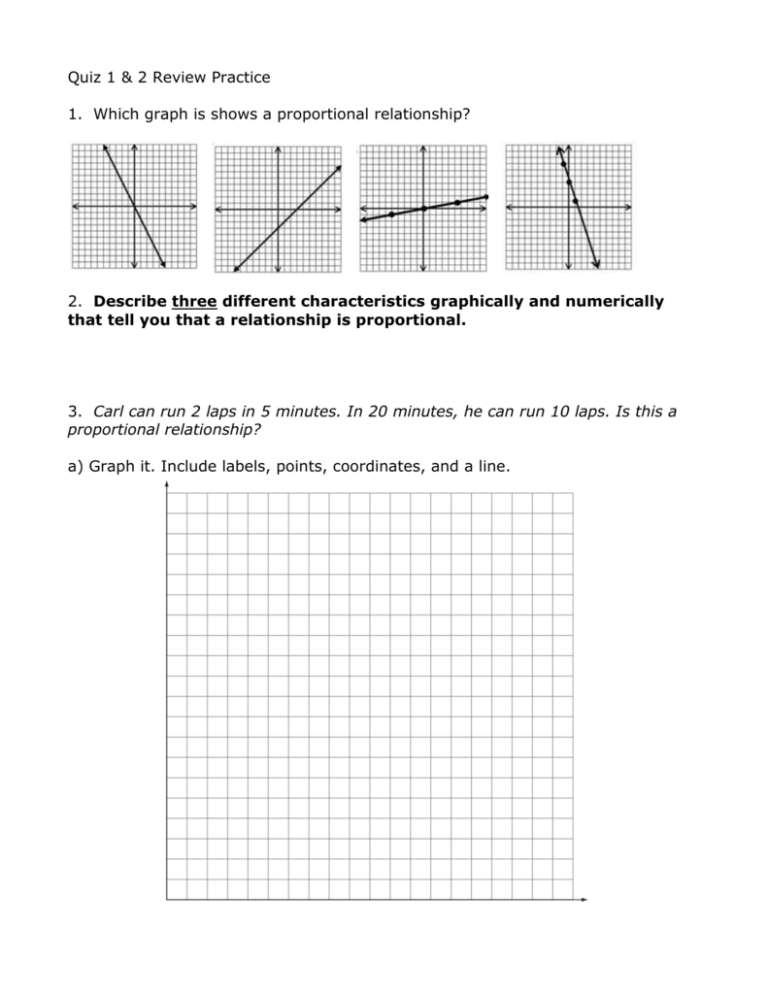
Quiz 1 & 2 Review Practice 1. Which graph is shows a proportional relationship? 2. Describe three different characteristics graphically and numerically that tell you that a relationship is proportional. 3. Carl can run 2 laps in 5 minutes. In 20 minutes, he can run 10 laps. Is this a proportional relationship? a) Graph it. Include labels, points, coordinates, and a line. b) Show mathematically whether or not this is a proportional relationship. 4. For every 3 newspapers Becky folds, Brad folds 4 newspapers. After 20 minutes pass, Becky has folded 15 newspapers while Brad has folded 20 newspapers. Is this a proportional relationship? a) Graph it. Include labels, points, coordinates, and a line. b) Show mathematically whether this is a proportional relationship. 5. In PE, five out of every six girls finishes a run in less than 10 minutes. Two out of three boys finishes a run in less than 10 minutes. Is this a proportional relationship? a) Model this problem using fraction squares. b) Show mathematically whether this is proportional relationship or not. 6. Ms. Turny’s class ratio of boys to girls is 2:3, and Mr. Straight’s class ratio of boys to girls is 8:12. Is this a proportional relationship? a) Model this problem using fraction squares. b) Show mathematically whether this is proportional relationship or not. 7. Describe what a unit rate is and give an example of a unit rate for a ratio of your choice. 8. Carson can jump 30 times in 18 seconds. He can jump 20 times in 12 seconds. Assume that the number of times Carson can jump is proportional to the number of seconds he is given. Find the constant of proportionality. a) a) Graph it. Include labels, points, coordinates, and a line. (You will need to adjust the scale in order to make the points fit.) b) On the graph, draw the distance between the X-coordinates and the Ycoordinates. (It should look like a right triangle). Label the distances. c) Method 1: Divide the Y distance by the X distance (show this as a ratio). This is one way to find the constant of proportionality. Show your work below. d) Method 2: Pick a coordinate and write it as a ratio. Find an equivalent ratio with a denominator of 1. This is another way to find the constant of proportionality. Show you work below. e) Method 3: Pick a coordinate and write it as a ratio. Divide the numerator by the denominator. This is another way to find the constant of proportionality. Show you work below. f) Mark the constant of proportionality on the graph with a point and label the point with its coordinates. 9. a) Make a table of 5 ordered pairs. b) Draw a line. Is this graph proportional? c) Determine the constant of proportionality. Show your work. d) Use the constant of proportionality to write an equation for the graph in the form of y = mx. e) Using the equation, find 3 more x and y coordinates that will not fit on this graph but that you know are on the line of proportionality. Show your work. 10.. a) Use the table to create a graph. x y 0.5 1.5 1.5 4.5 2.5 7.5 b) Draw a line. Is this graph proportional? c) Determine the constant of proportionality. Show your work. d) Use the constant of proportionality to write an equation for the graph in the form of y = mx. e) Using the equation, find 3 more x and y coordinates that will not fit on this graph but that you know are on the line of proportionality. Show your work.


