Data augmentation
advertisement
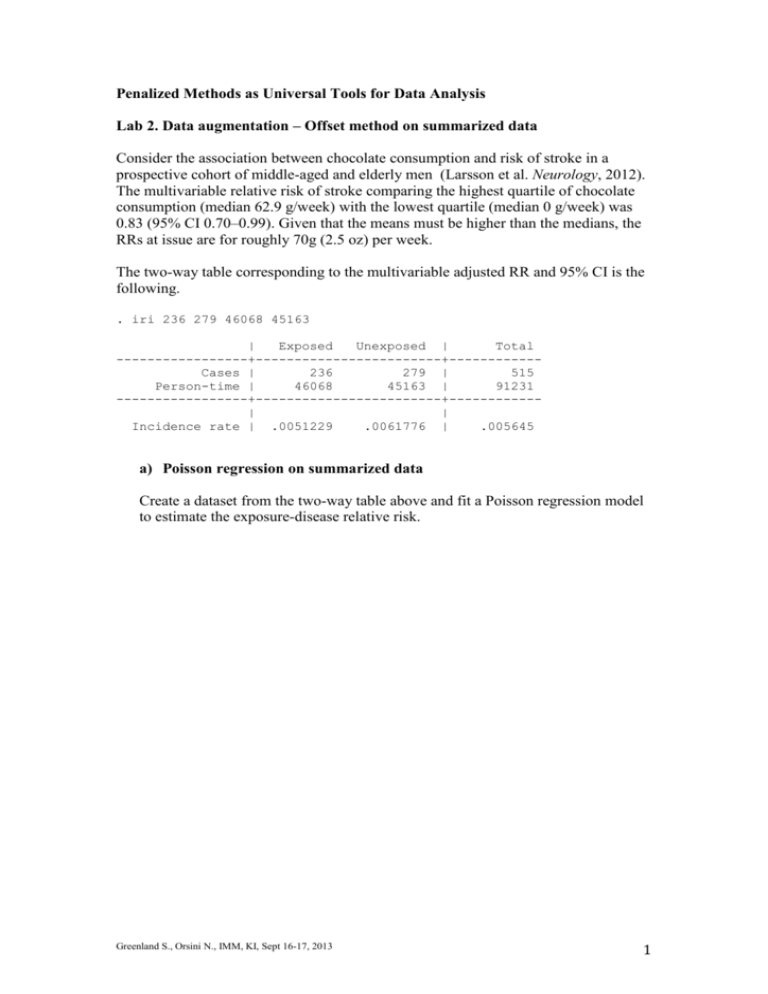
Penalized Methods as Universal Tools for Data Analysis Lab 2. Data augmentation – Offset method on summarized data Consider the association between chocolate consumption and risk of stroke in a prospective cohort of middle-aged and elderly men (Larsson et al. Neurology, 2012). The multivariable relative risk of stroke comparing the highest quartile of chocolate consumption (median 62.9 g/week) with the lowest quartile (median 0 g/week) was 0.83 (95% CI 0.70–0.99). Given that the means must be higher than the medians, the RRs at issue are for roughly 70g (2.5 oz) per week. The two-way table corresponding to the multivariable adjusted RR and 95% CI is the following. . iri 236 279 46068 45163 | Exposed Unexposed | Total -----------------+------------------------+-----------Cases | 236 279 | 515 Person-time | 46068 45163 | 91231 -----------------+------------------------+-----------| | Incidence rate | .0051229 .0061776 | .005645 a) Poisson regression on summarized data Create a dataset from the two-way table above and fit a Poisson regression model to estimate the exposure-disease relative risk. Greenland S., Orsini N., IMM, KI, Sept 16-17, 2013 1 b) Poisson regression on augmented data with a null centre prior Enter the data corresponding to a prior with 0.95 probability on RR between 0.8 and 1.25. Fit a Poisson regression model on augmented data. Is the posterior relative risk similar to information-weighted averaging? c) Poisson regression on augmented data with a non-null centre prior The pooled relative risk of stroke for approximately 70 gr per week of chocolate consumption was 0.707 (95% CI 0.565–0.885). Consider the results of this meta-analysis to inform the prior and augment the observed data. Fit a Poisson regression model on augmented data. Greenland S., Orsini N., IMM, KI, Sept 16-17, 2013 2
