Modelling the Ocean Floor Lab
advertisement
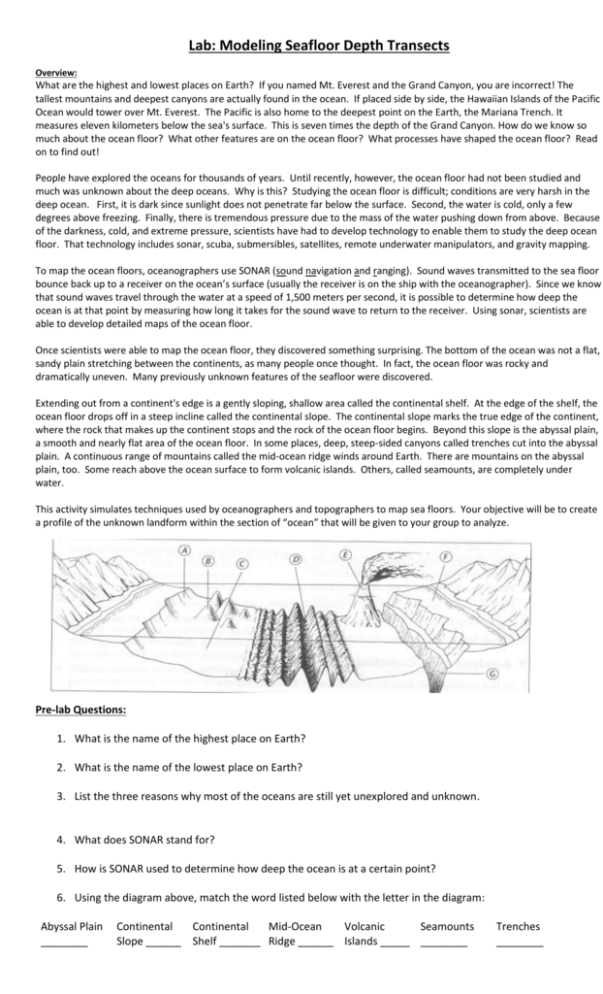
Lab: Modeling Seafloor Depth Transects Overview: What are the highest and lowest places on Earth? If you named Mt. Everest and the Grand Canyon, you are incorrect! The tallest mountains and deepest canyons are actually found in the ocean. If placed side by side, the Hawaiian Islands of the Pacific Ocean would tower over Mt. Everest. The Pacific is also home to the deepest point on the Earth, the Mariana Trench. It measures eleven kilometers below the sea's surface. This is seven times the depth of the Grand Canyon. How do we know so much about the ocean floor? What other features are on the ocean floor? What processes have shaped the ocean floor? Read on to find out! People have explored the oceans for thousands of years. Until recently, however, the ocean floor had not been studied and much was unknown about the deep oceans. Why is this? Studying the ocean floor is difficult; conditions are very harsh in the deep ocean. First, it is dark since sunlight does not penetrate far below the surface. Second, the water is cold, only a few degrees above freezing. Finally, there is tremendous pressure due to the mass of the water pushing down from above. Because of the darkness, cold, and extreme pressure, scientists have had to develop technology to enable them to study the deep ocean floor. That technology includes sonar, scuba, submersibles, satellites, remote underwater manipulators, and gravity mapping. To map the ocean floors, oceanographers use SONAR (sound navigation and ranging). Sound waves transmitted to the sea floor bounce back up to a receiver on the ocean’s surface (usually the receiver is on the ship with the oceanographer). Since we know that sound waves travel through the water at a speed of 1,500 meters per second, it is possible to determine how deep the ocean is at that point by measuring how long it takes for the sound wave to return to the receiver. Using sonar, scientists are able to develop detailed maps of the ocean floor. Once scientists were able to map the ocean floor, they discovered something surprising. The bottom of the ocean was not a flat, sandy plain stretching between the continents, as many people once thought. In fact, the ocean floor was rocky and dramatically uneven. Many previously unknown features of the seafloor were discovered. Extending out from a continent's edge is a gently sloping, shallow area called the continental shelf. At the edge of the shelf, the ocean floor drops off in a steep incline called the continental slope. The continental slope marks the true edge of the continent, where the rock that makes up the continent stops and the rock of the ocean floor begins. Beyond this slope is the abyssal plain, a smooth and nearly flat area of the ocean floor. In some places, deep, steep-sided canyons called trenches cut into the abyssal plain. A continuous range of mountains called the mid-ocean ridge winds around Earth. There are mountains on the abyssal plain, too. Some reach above the ocean surface to form volcanic islands. Others, called seamounts, are completely under water. This activity simulates techniques used by oceanographers and topographers to map sea floors. Your objective will be to create a profile of the unknown landform within the section of “ocean” that will be given to your group to analyze. Pre-lab Questions: 1. What is the name of the highest place on Earth? 2. What is the name of the lowest place on Earth? 3. List the three reasons why most of the oceans are still yet unexplored and unknown. 4. What does SONAR stand for? 5. How is SONAR used to determine how deep the ocean is at a certain point? 6. Using the diagram above, match the word listed below with the letter in the diagram: Abyssal Plain ________ Continental Continental Mid-Ocean Volcanic Seamounts Slope ______ Shelf _______ Ridge ______ Islands _____ ________ Trenches ________ Lab: Modeling Seafloor Depth Transects Materials: (per group of 2 or 3) 1 - Cardboard grid “mystery” box 1 - Depth-sounding rod Student data sheet with grid Procedure: 1. 2. 3. 4. DO NOT OPEN THE BOX!!! Record the mystery box number on your student data sheet. Insert the depth sounding rod at row 0, column 0. CAREFULLY lower the depth-sounding rod through the hole in the cardboard mystery box until it just barely touches the mystery ocean floor feature in the box. 5. Holding the depth-sounding rod with your thumb and forefinger at the point where the rod comes out of the box, slowly remove the rod from the box. 6. Use the metric ruler on the box top to measure the number of centimeters from the spot marked by your fingertips to the end of the rod. (This is your depth reading) 7. Use the grid on your student data sheet to record the number of centimeters. Locate the (0,0) coordinate and plot your depth reading. 8. Repeat this procedure across the number 0 row: (0,0) (0,15) 9. Connect the dots. Then cut along this line to eliminate the empty space. 10. Fold the bottom of the graph along the fold line and glue to the “Master” grid along row 0. 11. Repeat these steps for each row 0-10. 12. By the end you will have a 3-D model of your mystery ocean floor. Analysis Questions: 1. Based on your contour profile, what part of the ocean floor was being modeled in your box? (Volcano, Rift Valley, Seamount, ridge etc.) 2. How is your topographical feature formed? (ex. Plate tectonics, erosion, magma, etc…) 3. a. How does the profile on your graph compare to the contour of your model? b. Are there any major features in the model that did not appear on your graph? c. Why or why not? 4. What process, used by Oceanographers, did this lab simulate to map the ocean floor?


