Cheat sheet
advertisement
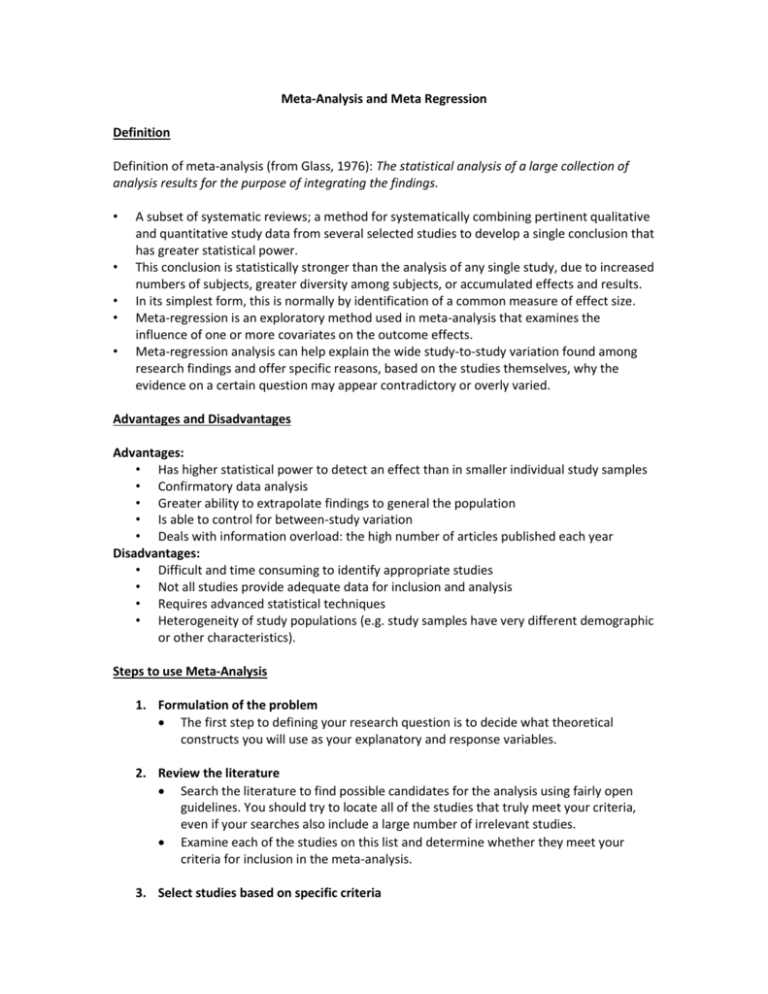
Meta-Analysis and Meta Regression Definition Definition of meta-analysis (from Glass, 1976): The statistical analysis of a large collection of analysis results for the purpose of integrating the findings. • • • • • A subset of systematic reviews; a method for systematically combining pertinent qualitative and quantitative study data from several selected studies to develop a single conclusion that has greater statistical power. This conclusion is statistically stronger than the analysis of any single study, due to increased numbers of subjects, greater diversity among subjects, or accumulated effects and results. In its simplest form, this is normally by identification of a common measure of effect size. Meta-regression is an exploratory method used in meta-analysis that examines the influence of one or more covariates on the outcome effects. Meta-regression analysis can help explain the wide study-to-study variation found among research findings and offer specific reasons, based on the studies themselves, why the evidence on a certain question may appear contradictory or overly varied. Advantages and Disadvantages Advantages: • Has higher statistical power to detect an effect than in smaller individual study samples • Confirmatory data analysis • Greater ability to extrapolate findings to general the population • Is able to control for between-study variation • Deals with information overload: the high number of articles published each year Disadvantages: • Difficult and time consuming to identify appropriate studies • Not all studies provide adequate data for inclusion and analysis • Requires advanced statistical techniques • Heterogeneity of study populations (e.g. study samples have very different demographic or other characteristics). Steps to use Meta-Analysis 1. Formulation of the problem The first step to defining your research question is to decide what theoretical constructs you will use as your explanatory and response variables. 2. Review the literature Search the literature to find possible candidates for the analysis using fairly open guidelines. You should try to locate all of the studies that truly meet your criteria, even if your searches also include a large number of irrelevant studies. Examine each of the studies on this list and determine whether they meet your criteria for inclusion in the meta-analysis. 3. Select studies based on specific criteria 1) Selection Criteria Study design - Randomized experimental design or quasi-experimental nonrandomized studies. Year of publication – the more up-to-date the better Sample sizes – very small studies pose challenges for treatment effect Completeness of information – make sure the study is well-specified to the subject 2) Potential Design Problems Publication Bias – exaggerated effects can occur from the difficulty in publishing negative results. Also known as a “file drawer” problem (See funnel charts below). “Cherry Picking”-Economic, social, political or personal bias can lead to excluding relevant or including irrelevant cases in the analysis. 4. Decide the dependent variables and summary statistics Differences (discrete data) Means (continuous data) 5. Select the effects model Select the isolated effects of study Fixed effects model: assumes that all studies in the meta analysis are samples of a single study, and all their results reflect a single underlying "true" effect size, so all the variations in the data set are reflected in the variance of individual studies. Random effects model: assumes that the studies are conducted independently, each reflect a separate "true" effect size, and the meta analysis is a combination of different studies on the same subject matter. Therefore, there exists an additional between studies variance, the Tau Squared (τ2), which needs to be estimated and included in the analysis. Step to Meta-regression 1. Create matrices needed for the calculation. Column for n, effect size, covariates, weights, and standard errors. 2. Calculate the regression formula y=a +bx 3. Calculate the residual variance 4. Calculate the between study variation τ2 5. Present Results Meta-regression Models: • Simple Regression: • Fixed Effect Meta-Regression: • Random Effects Meta-Regression: Where is the effect size in study and (intercept) the estimated overall effect size. The variables specify different characteristics of the study, specifies the between study variation. Note that this model does not allow specification of within study variation. Example Links Health Care Research Cochrane Collaboration www.cochrane.org Predicting Elections Princeton Election Consortium www.election.princeton.edu Benefit-Cost Analysis Washington State Institute for Public Policy WSIPP www.wsipp.wa.gov How to use Meta-Analysis in STATA: A simple meta-analysis could be conducted in Access or Excel. Stata does not have a built-in meta-analysis command, but there are multiple user-developed options for conducting metaanalysis that can be installed. meta Inverse variance weighted fixed and random effects meta-analysis. Includes a ghp command for generating graphics (including forest plots). metan Uses effect estimates and standard error or mean and standard deviation for each study. metap combines user entered p values for each study. metareg does meta regression, requires user entered treatment effect estimates and standard errors for each study. metafunnel Generates funnel plots to test for publication bias in included studies. See for more information about available meta-analysis add ons in Stata: http://www.stata.com/meeting/10uk/meta_stata.pdf
