Hypothesis Testing for a Population Mean
advertisement
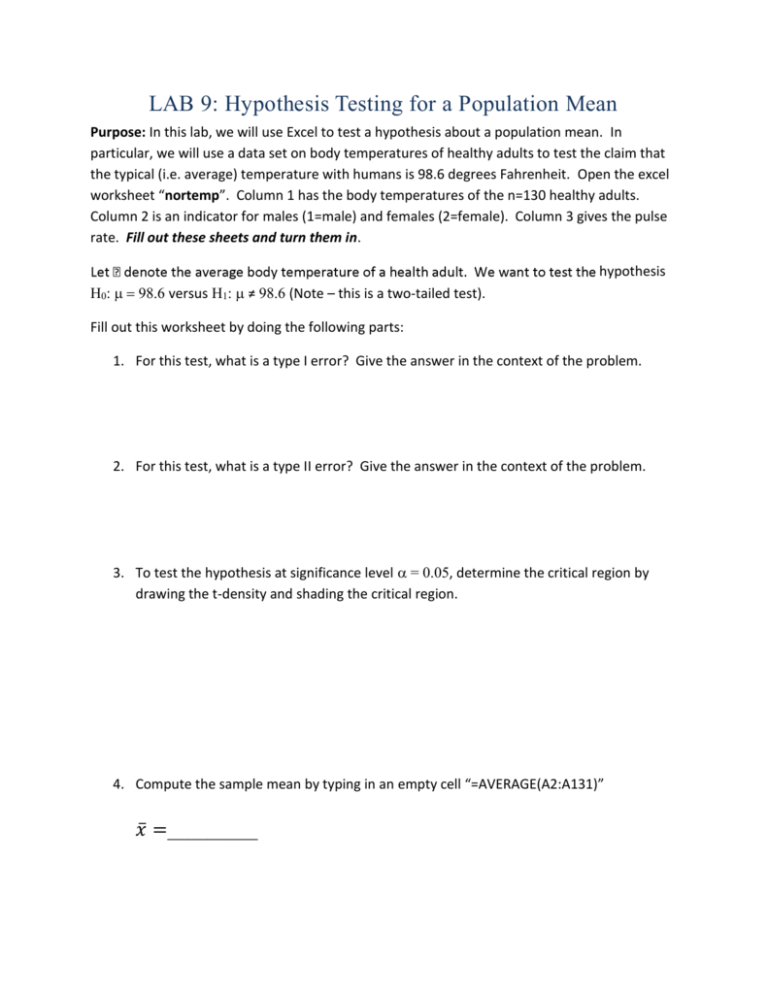
LAB 9: Hypothesis Testing for a Population Mean Purpose: In this lab, we will use Excel to test a hypothesis about a population mean. In particular, we will use a data set on body temperatures of healthy adults to test the claim that the typical (i.e. average) temperature with humans is 98.6 degrees Fahrenheit. Open the excel worksheet “nortemp”. Column 1 has the body temperatures of the n=130 healthy adults. Column 2 is an indicator for males (1=male) and females (2=female). Column 3 gives the pulse rate. Fill out these sheets and turn them in. hypothesis H0: versus H1: ≠ 98.6 (Note – this is a two-tailed test). Fill out this worksheet by doing the following parts: 1. For this test, what is a type I error? Give the answer in the context of the problem. 2. For this test, what is a type II error? Give the answer in the context of the problem. 3. To test the hypothesis at significance level = 0.05, determine the critical region by drawing the t-density and shading the critical region. 4. Compute the sample mean by typing in an empty cell “=AVERAGE(A2:A131)” 𝑥̅ =_________ 5. Compute the sample standard deviation by typing in an empty cell “=STDEV(A2:A131)” s = ________ 6. Compute the t-test statistic manually 𝑥̅ −𝜇 t= = 𝑠/√𝑛 7. Does the t-test statistic fall in the critical region from #3? (Circle one) YES NO 8. Write a sentence giving the conclusion to this hypothesis test in the context of the problem (be sure to specify the significance level in your conclusion). 9. Compute the P-value for this test using the “tdist” function in excel. To use the tdist function, click on an empty cell and type in “=TDIST(5.458,129,2)”. p-value = ____________________________ 10. Based on the p-value, does it seem plausible that the average body temperature is 98.6? Explain.

