2b Grip Strength Handout
advertisement
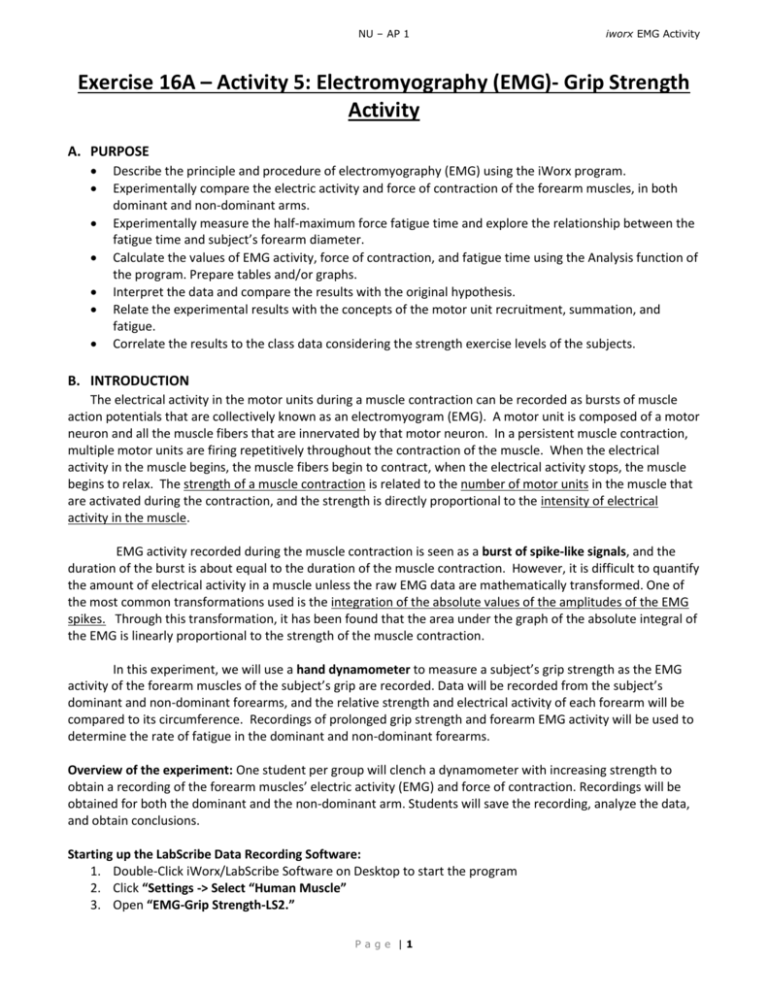
NU – AP 1 iworx EMG Activity Exercise 16A – Activity 5: Electromyography (EMG)- Grip Strength Activity A. PURPOSE Describe the principle and procedure of electromyography (EMG) using the iWorx program. Experimentally compare the electric activity and force of contraction of the forearm muscles, in both dominant and non-dominant arms. Experimentally measure the half-maximum force fatigue time and explore the relationship between the fatigue time and subject’s forearm diameter. Calculate the values of EMG activity, force of contraction, and fatigue time using the Analysis function of the program. Prepare tables and/or graphs. Interpret the data and compare the results with the original hypothesis. Relate the experimental results with the concepts of the motor unit recruitment, summation, and fatigue. Correlate the results to the class data considering the strength exercise levels of the subjects. B. INTRODUCTION The electrical activity in the motor units during a muscle contraction can be recorded as bursts of muscle action potentials that are collectively known as an electromyogram (EMG). A motor unit is composed of a motor neuron and all the muscle fibers that are innervated by that motor neuron. In a persistent muscle contraction, multiple motor units are firing repetitively throughout the contraction of the muscle. When the electrical activity in the muscle begins, the muscle fibers begin to contract, when the electrical activity stops, the muscle begins to relax. The strength of a muscle contraction is related to the number of motor units in the muscle that are activated during the contraction, and the strength is directly proportional to the intensity of electrical activity in the muscle. EMG activity recorded during the muscle contraction is seen as a burst of spike-like signals, and the duration of the burst is about equal to the duration of the muscle contraction. However, it is difficult to quantify the amount of electrical activity in a muscle unless the raw EMG data are mathematically transformed. One of the most common transformations used is the integration of the absolute values of the amplitudes of the EMG spikes. Through this transformation, it has been found that the area under the graph of the absolute integral of the EMG is linearly proportional to the strength of the muscle contraction. In this experiment, we will use a hand dynamometer to measure a subject’s grip strength as the EMG activity of the forearm muscles of the subject’s grip are recorded. Data will be recorded from the subject’s dominant and non-dominant forearms, and the relative strength and electrical activity of each forearm will be compared to its circumference. Recordings of prolonged grip strength and forearm EMG activity will be used to determine the rate of fatigue in the dominant and non-dominant forearms. Overview of the experiment: One student per group will clench a dynamometer with increasing strength to obtain a recording of the forearm muscles’ electric activity (EMG) and force of contraction. Recordings will be obtained for both the dominant and the non-dominant arm. Students will save the recording, analyze the data, and obtain conclusions. Starting up the LabScribe Data Recording Software: 1. Double-Click iWorx/LabScribe Software on Desktop to start the program 2. Click “Settings -> Select “Human Muscle” 3. Open “EMG-Grip Strength-LS2.” Page |1 NU – AP 1 iworx EMG Activity C. EXPERIMENT SET-UP 1. Remove all jewelry, watches, etc. from wrists. 2. Use an alcohol swab to clean and scrub the 3 regions on the inside of the subject’s dominant forearm where the electrodes will be placed. 3. Remove the plastic disk from a disposable electrode and snap lead wires onto the disposable electrodes (Figure 1). 4. Attach the disposable electrodes on the regions describes below (Figure 2). RED (+1) LEAD is attached to the electrode near the ELBOW BLACK (-1) LEAD is attached to the electrode in the MIDDLE of the FOREARM GREEN (C) LEAD (the ground) is attached to the electrode on the WRIST Figure 1 – Wires attached Figure 2 – Then, Electrodes attached Page |2 NU – AP 1 iworx EMG Activity D. PROCEDURES and DATA ANALYSIS I. Recording of Data Figure 3a – Relax State, No Grip on Hand Dynamometer. Figure 3b – Grip and Clench on Hand Dynamometer 1. Subject should sit quietly with the dominant forearm being studied resting on the table top. 2. READ/MEMORIZE THE FOLLOWING PATTERN: Subject will clench his/her fist around the hand dynamometer four times, each time for two seconds followed by two seconds of relaxation. Each clench should be stronger than the previous one (Figure 3a and 3b) Subject will wait for 10-15 seconds and then clench the hand dynamometer as tight and as long as possible in an attempt to fatigue the muscles of the forearm. (Please try not to lose your grip on the dynamometer) When the subject’s clench force falls below 50% of the maximum clench force, the recording can be halted. 3. Click Record. 4. Subject begins squeezing the hand dynamometer as directed in Step 2. 5. After the last relaxation period, click Stop. 6. Click Autoscale for both the EMG and Muscle Force channels. Your recording should look similar to Figure 4a and Figure 4b. 7. Save data onto desktop with group name and date. Page |3 NU – AP 1 iworx EMG Activity Figure 4a – Recording of Incremental Clench Force. Figure 4b – Recording of Maximum Clench Force. EMG EMG (Top channel) and Muscle Force Channels(channel) (Top channel) and Muscle Force Channels(Bottom Channel) II. Analysis of Data - Incremental Clench Force from the Dominant and Non-dominant Forearms 1. Click Analysis Window button located on the top menu bar (Figure 5). Figure 5 – Shortcut buttons on LabScribe software 2. The mathematical functions, Abs. Area, V2-V1, and T2-T1 are located above the uppermost channel. Use the mouse to click on and drag the cursors to the beginning and end of the first muscle contraction. (As shown in Figure 6). The values for the Abs. Area on the EMG and Muscle Force channels are the relative amount of electrical activity causing the contraction and relative strength of the muscle respectively. i. Measure and record absolute areas under the EMG and Muscle Force for each Grip Strength. Record the data on Table 1 and Excel File provided on Desktop of your Laptop. Double Click on iworx_EMG_dataTablesGraph.xls file to open and input your data ii. A graph (scattered dot plot) will be automatically generated from your data on the Excel file. You can see the regression and linearity relationship when Grip Strength (Muscle Force) is a function of the area under the absolute integral of EMG activity. III. Analysis of Data – Muscle Fatigue in the Dominant and Non-dominant Forearms 1. On the Muscle Force channel, place one cursor on the baseline, before the maximum muscle force on Muscle Force channel, and place the second cursor on the peak (max. amplitude) of the maximum muscle force. 2. Record the V2-V1 value on Table 2 as Max Clench Force. Page |4 NU – AP 1 iworx EMG Activity 3. Calculate the half (divide by 2) value of the Max Clench Force and record as 50% of Max Clench Force on Table 2. 4. Place one cursor on the peak muscle force and move the other cursor on the top the first one to get T2T1 function 0.000. Then, move the second cursor until you see the V2-V1 equals (can be approximate) to 50% of Max Clench Force. Record the time, T2-T1 at that point as Half-Max Fatigue Time on Table 2 Figure 6 – One EMG signal and Clench Force is selected between the two cursors from on baseline to the other one. Table 1 – Effect of EMG Activity on the Relative Strength in the Dominant and Non-dominant Forearms Effect of EMG Activity on the Relative Muscle Strength Diameter = Diameter = Dominant Relative Grip Strength Abs EMG Activity Abs Area Force Curve Lowest Higher 1 Higher 2 Higher 3 Highest Page |5 Nondominant Abs EMG Activity Abs Area Force Curve NU – AP 1 iworx EMG Activity Table 2 – Fatigue Measurements After Maximum Clench Force in Dominant and Non-dominant Forearms Fatigue Measurements Dominant Forearm Max. Clench Force (Kg) 50% of Max Clench Force (Kg) NonDominant Forearm Half-Max Fatigue Time (sec) Max. Clench Force (Kg) 50% of Max Clench Force (Kg) Half-Max Fatigue Time (sec) MuscleStrengthening Activity Level (see criteria below) Criteria for Muscle Strengthening Exercise Levels1 (Lifting weights, working with resistance bars, push ups, sit ups, heavy gardening, yoga, etc) MuscleStrengthening Activity Level 0 1 2 3 4 5 Exercise Frequency Never performs Muscle Strengthening Exercises Performs Muscle Strengthening Exercises 1 time a week Performs Muscle Strengthening 2 times a week Performs Muscle Strengthening 3 times a week Performs Muscle Strengthening 4 times a week Performs Muscle Strengthening more than 4 times a week 1 Physical Activity for Everyone. Centers for Disease Control and Prevention. http://www.cdc.gov/physicalactivity/everyone/guidelines/adults.html#Musclestrengthening Page |6 Gender NU – AP 1 iworx EMG Activity E. QUESTIONS 1. Is there a linear relationship between the absolute area under EMG signals and the absolute area under the muscle contraction? Why? 2. Compare the values of forearm circumference and the half-max muscle force fatigue times recorded from dominant and non-dominant arms in the whole class. How the “strength exercise levels of the subject affected their half-max fatigue times? 3. Compare the EMG signal and the force of contraction for your subject’s dominant and non-dominant arm. How can you explain the results? Consider factors such as motor unit recruitment, muscle fiber diameter, muscle fiber force, and fiber types. 4. In this EMG activity the muscle contraction is performed from rest, it is intense and lasts for a short time. This is typical of what kind of exercise? How can ATP be generated for this activity? 5. How might dynamometry be used to assess patients in a clinical setting? Page |7
