Restriction Digestion Laboratory
advertisement
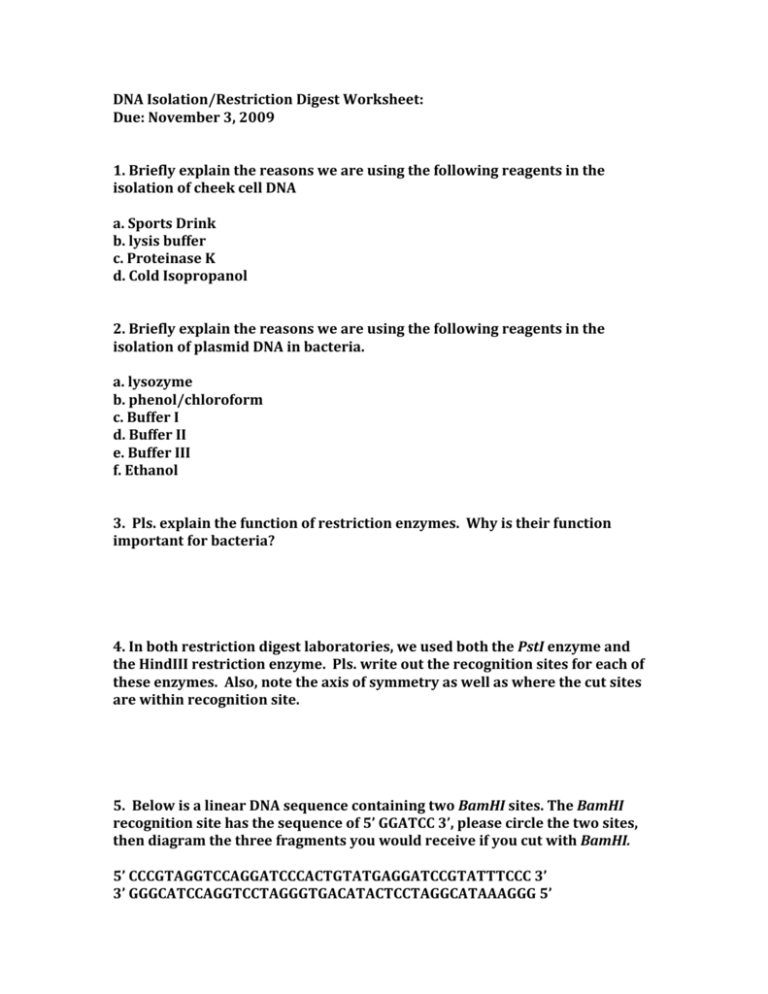
DNA Isolation/Restriction Digest Worksheet: Due: November 3, 2009 1. Briefly explain the reasons we are using the following reagents in the isolation of cheek cell DNA a. Sports Drink b. lysis buffer c. Proteinase K d. Cold Isopropanol 2. Briefly explain the reasons we are using the following reagents in the isolation of plasmid DNA in bacteria. a. lysozyme b. phenol/chloroform c. Buffer I d. Buffer II e. Buffer III f. Ethanol 3. Pls. explain the function of restriction enzymes. Why is their function important for bacteria? 4. In both restriction digest laboratories, we used both the PstI enzyme and the HindIII restriction enzyme. Pls. write out the recognition sites for each of these enzymes. Also, note the axis of symmetry as well as where the cut sites are within recognition site. 5. Below is a linear DNA sequence containing two BamHI sites. The BamHI recognition site has the sequence of 5’ GGATCC 3’, please circle the two sites, then diagram the three fragments you would receive if you cut with BamHI. 5’ CCCGTAGGTCCAGGATCCCACTGTATGAGGATCCGTATTTCCC 3’ 3’ GGGCATCCAGGTCCTAGGGTGACATACTCCTAGGCATAAAGGG 5’ 6. You are working with a plasmid (circular DNA) with 2 EcoRI sites. If you cut with EcoRI, how many fragments will you get? 7. If you are working with a linear piece of DNA with 3 EcoRI sites, if you cut with EcoRI, how many fragments would you receive? 8. For each of the reagents below, or steps below explain their purpose in a restriction digest a. Restriction Buffer b. DNA c. 37 C incubation d. restriction enzyme 9. For each digest of the pBR322 and vector, after you ran your agarose gel, state how many bands you received. 10. For each digest of the pUC19 vector, after you ran your agarose gel, state how many bands you received. 11. For each digest of pBR322, calculate the size of each band you received. First build a standard curve by using your ladder (pictured on the website). First, for each band on your ladder, determine how far it ran from the top of the gel (in mm). Next develop a graph, using excel, where you plot distance ran on the X-axis and log (band size) on the Y axis for each band on your ladder. Next draw a trend line through your points. When you do so, choose the logarithmic trend line function. When you draw your trend line, also choose to display the equation on your graph. This graph is your standard curve. Once you have your standard curve, measure the distance of the bands in your digest lanes. Plug those into your standard curve to receive your band size (Be aware that when you plug your numbers into the graph, you will get the log of the band size. Therefore, be sure to use the inverse log function). 12. For each digest of pUC19, calculate the size of each band you received. First build a standard curve by using your ladder (pictured on the website). First, for each band on your ladder, determine how far it ran from the top of the gel (in mm). Next develop a graph, using excel, where you plot distance ran on the X-axis and log (band size) on the Y-axis for each band on your ladder. Next draw a trend line through your points. When you do so, choose the logarithmic trend line function. When you draw your trend line, also choose to display the equation on your graph. This graph is your standard curve. Once you have your standard curve, measure the distance of the bands in your digest lanes. Plug those into your standard curve to receive your band size (Be aware that when you plug your numbers into the graph, you will get the log of the band size. Therefore, be sure to use the inverse log function).
