2119 HW 2 Total Score: 69 out of 93. 1. a. Sample Size Sample
advertisement
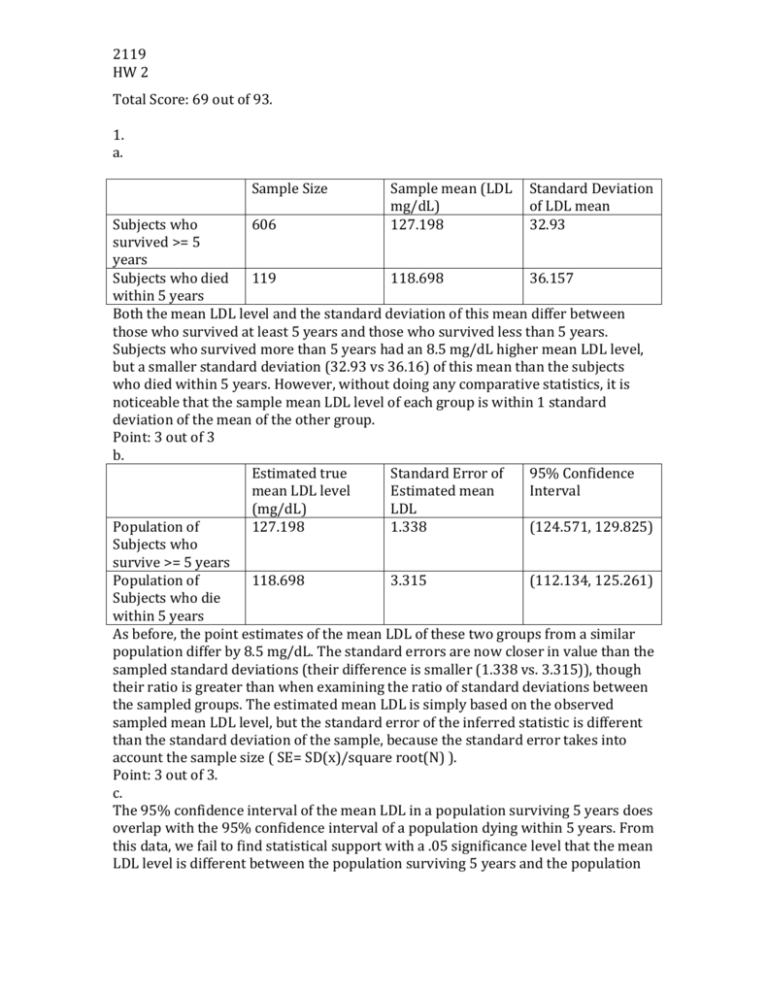
2119 HW 2 Total Score: 69 out of 93. 1. a. Sample Size Sample mean (LDL mg/dL) 127.198 Standard Deviation of LDL mean 32.93 Subjects who 606 survived >= 5 years Subjects who died 119 118.698 36.157 within 5 years Both the mean LDL level and the standard deviation of this mean differ between those who survived at least 5 years and those who survived less than 5 years. Subjects who survived more than 5 years had an 8.5 mg/dL higher mean LDL level, but a smaller standard deviation (32.93 vs 36.16) of this mean than the subjects who died within 5 years. However, without doing any comparative statistics, it is noticeable that the sample mean LDL level of each group is within 1 standard deviation of the mean of the other group. Point: 3 out of 3 b. Estimated true Standard Error of 95% Confidence mean LDL level Estimated mean Interval (mg/dL) LDL Population of 127.198 1.338 (124.571, 129.825) Subjects who survive >= 5 years Population of 118.698 3.315 (112.134, 125.261) Subjects who die within 5 years As before, the point estimates of the mean LDL of these two groups from a similar population differ by 8.5 mg/dL. The standard errors are now closer in value than the sampled standard deviations (their difference is smaller (1.338 vs. 3.315)), though their ratio is greater than when examining the ratio of standard deviations between the sampled groups. The estimated mean LDL is simply based on the observed sampled mean LDL level, but the standard error of the inferred statistic is different than the standard deviation of the sample, because the standard error takes into account the sample size ( SE= SD(x)/square root(N) ). Point: 3 out of 3. c. The 95% confidence interval of the mean LDL in a population surviving 5 years does overlap with the 95% confidence interval of a population dying within 5 years. From this data, we fail to find statistical support with a .05 significance level that the mean LDL level is different between the population surviving 5 years and the population 2119 HW 2 dying within 5 years. However, a more accurate test to examine this would be a 2 sample 2 sided t test. Point: 3 out of 3. d. If we presume equal variances in the two populations, then an estimate for the standard deviation in each group is 33.602, the standard deviation amongst the groups combined. Point: 0 out of 3. e. Estimated difference in mean LDL level (mg/dL) Difference in population mean LDL between those surviving >= 5 years and those dying within 5 years 8.5005 Standard Error of Estimated difference in mean LDL 3.357 95% Confidence Interval (1.911, 15.090) With a .05 significance level, we can conclude that the mean LDL level is different between populations who survive greater than 5 years and those that die within 5 years with a p-value of 0.0115. Those who survive >= 5 years have a mean 8.5 mg/dL higher LDL level, with a 95% confidence interval of this difference being (1.911, 15.090). Point: 2 out of 3. The conclusion about the association between serum LDL and 5 year all cause mortality is, that surviving subjects would tend toward higher mean serum LDL. 2. a. Both of these models are saturated, because the predictor variables (alive after 5 years or dead within 5 years) both only have 2 values. Point: 1 out of 2. b. Using the model based on a predictor of interest being if they died within 5 years, the estimate for the mean LDL amongst a population of subjects who survive 5 years is 127.198 mg/dL. This value is the same value for the estimate for the mean LDL amongst a population of subjects who survive 5 years found in problem one using a t test. This makes sense when examining the modeled equation based on this model. 2119 HW 2 The intercept, or Beta0, is 127.198, which means the mean LDL level of those coded at 0 (those alive after 5 years) is 127.198 mg/dL. Point: 2 out of 2. c. Using the model based on a predictor of interest being if they died within 5 years, the 95% confidence interval for the true mean LDL of a population of subjects who survive at least 5 years is (124.528, 129.868). This is very close to the corresponding estimate based on a t test from problem 1 (which was (124.571, 129.825)), but not exact. The small difference comes from the fact that we are using a regression model that presumes homoscedasticity, while there is heteroscedasticity between the predictor of interest groups. If we use a robust linear regression model that allows for heteroscedasticity, then we get the exact same value for the 95% confidence interval as the t test. Point: 2 out of 2 d. Using the model based on a predictor of interest being if they were alive at 5 years, the estimate for the mean LDL amongst a population of subjects who die within 5 years is 118.698 mg/dL. This value is the same value for the estimate for the mean LDL amongst a population of subjects who die within 5 years found in problem one using a t test. This makes sense when examining the modeled equation based on this model. The intercept, or Beta0, is 118.698, which means the mean LDL level of those coded at 0 (those dead within 5 years) is 118.698 mg/dL. Point: 1 out of 2. e. Using the model based on a predictor of interest being if they were alive at 5 years, the 95% confidence interval for the true mean LDL of a population of subjects who die within 5 years is (112.673, 124.722). This is very close to the corresponding estimate based on a t test from problem 1, but not exact. The small difference comes from the fact that we are using a regression model that presumes homoscedasticity, while there is heteroscedasticity between the predictor of interest groups. If we use a robust linear regression model that allows for heteroscedasticity, then we get the exact same value for the 95% confidence interval as the t test. Point: 1 out of 2 f. Using the model based on a predictor of interest being if they were alive at 5 years, the estimated standard deviation amongst a population of subjects who survive less than 5 years is 3.069 mg/dL. Using the model based on a predictor of interest dying within 5 years, the estimated standard deviation amongst a population of subjects who at least 5 years is 1.3609 mg/dL. Point: 0 out of 2. g. In model B (based on a predictor of interest being if they were alive at 5 years), the y intercept (Beta0)is the mean LDL level for those who died within 5 years (118.698 mg/dL), and the constant coefficient (Beta1) difference (8.5005 mg/dL) in mean LDL level between those who died within five years vs. those who survived at least 5 years. Beta1 is positive because the group that survived at least 5 years (coded as 1) has a larger mean LDL level. In model A (based on a predictor of interest being dead 2119 HW 2 at 5 years), the opposite is true. (Beta0) is the mean LDL level for those who survive at least 5 years (127.198 mg/dL), and the constant coefficient (Beta1) difference (8.5005 mg/dL) in mean LDL level between those who died within five years vs. those who survived at least 5 years. Beta1 is negative because the group that died within 5 years (coded as 1) has a smaller mean LDL level. Point: 2 out of 2. h. The intercept for regression model A is 127.198 mg/dL. This means that those coded as zero in this model (those who survived at least 5 years) have a mean LDL level of 127.198 mg/dL. Point: 2 out of 2. i. The slop in regression model A is -8.5005 mg/dL. This means that for every 1 that we increase in the predictor of interest variable, the response variable, LDL level, decreases 8.5005 mg/dL. Since we dichotomized our response variable based on vitality at 5 years, there are only two possible predictor of interest values in this model. A predictor of interest value of 0 was explained in part h, and a predictor of interest value of 1, being those who died within 5 years, would have an expected LDL level = 127.198 + (-8.5005*1) = 118.698 mg/dL. Point: 1 out of 2. The slope means difference. j. Estimated Standard Error of 95% Confidence difference in mean Estimated Interval LDL level (mg/dL) difference in mean LDL Difference in 8.5005 3.357 (1.911, 15.090) population mean LDL between those surviving >= 5 years and those dying within 5 years The p value is 0.012. With a .05 significance level, we can conclude that the mean LDL level is different between populations who survive greater than 5 years and those that die within 5 years with a p-value of 0.012. Those who survive >= 5 years have a mean 8.5 mg/dL higher LDL level, with a 95% confidence interval of this difference being (1.911, 15.090). This is the exact same result we get from the corresponding inference in problem one using a t test. Point: 2 out of 2. 3. The results from problem one, using a T test which assumes equal variances, is summarized below. Estimated true mean LDL level Standard Error of Estimated mean 95% Confidence Interval 2119 HW 2 Population of Subjects who survive >= 5 years Population of Subjects who die within 5 years Difference in population mean LDL between those surviving >= 5 years and those dying within 5 years (mg/dL) 127.198 LDL 1.338 (124.571, 129.825) 118.698 3.315 (112.134, 125.261) Estimated difference in mean LDL level (mg/dL) Standard Error of Estimated difference in mean LDL 3.357 95% Confidence Interval 8.5005 (1.911, 15.090) The results using a T test which allows for unequal variances is shown below. Estimated true Standard Error of 95% Confidence mean LDL level Estimated mean Interval (mg/dL) LDL Population of 127.198 1.338 (124.571, 129.825) Subjects who survive >= 5 years Population of 118.698 3.315 (112.134, 125.261) Subjects who die within 5 years Estimated Standard Error of 95% Confidence difference in mean Estimated Interval LDL level (mg/dL) difference in mean LDL Difference in 8.5005 3.57 (1.441, 15.560) population mean LDL between those surviving >= 5 years and those dying within 5 years All of the results are the same in the two analyses except for the standard error of the estimated difference in mean LDL (the standard error is higher in the test that 2119 HW 2 allows for unequal variances), and the corresponding confidence interval is therefore slightly larger. Point: 8 out of 10. A larger p value. 4. The table below shows the results from the regression model assuming homoscedasticity. Estimated true Standard Error of 95% Confidence mean LDL level Estimated mean Interval (mg/dL) LDL Population of 127.198 1.360 (124.528, 129.869) Subjects who survive >= 5 years Population of 118.698 3.3069 (112.673, 125.722) Subjects who die within 5 years Estimated Standard Error of 95% Confidence difference in mean Estimated Interval LDL level (mg/dL) difference in mean LDL Difference in 8.5005 3.357 (1.911, 15.095) population mean LDL between those surviving >= 5 years and those dying within 5 years The table below shows the results from the regression model allowing for heteroscedaticity. Population of Subjects who survive >= 5 years Population of Subjects who die within 5 years Difference in population mean Estimated true mean LDL level (mg/dL) 127.198 Standard Error of Estimated mean LDL 1.338 95% Confidence Interval 118.698 3.3051 (112.209, 125.186) Estimated difference in mean LDL level (mg/dL) Standard Error of Estimated difference in mean LDL 3.566 95% Confidence Interval 8.5005 (124.570, 129.826) (1.500, 15.501) 2119 HW 2 LDL between those surviving >= 5 years and those dying within 5 years The estimated true mean LDL level of each group, and the difference between groups are the same between the two analyses. However, the standard error for the estimated mean LDLs and the estimated difference in LDLs, and the corresponding confidence intervals, are all slightly different. Of note, the model that allows for heterscedasticity has lower standard errors of the estimated mean LDL levels of each group but a higher standard error of the estimated difference between groups. Point: 6 out of 10. Wider CI and larger P value. 5. a. Two regression models examining the association between serum LDL and age as a continuous variable, one only with males, and one only with females, were done. Descriptive statistics of these analyses are below. Y intercept of regression Slope Beta1 model Males only 144.12 mg/dL -0.315 Females only 114.24 mg/dL 0.224 Since the slopes of the regression models are not only different, but in different directions (one positive, one negative), and the y intercepts are very different, we can conclude that the association is confounded or modified by sex. Point: 0 out of 5. b. To evaluate the association between LDL and age, I compared the distribution of LDL across groups defined by age as a continuous variable by forming a robust linear regression model that allows for hetroscedasticity, uses age as the predictor of interest, and uses LDL as the outcome. Point: 3 out of 3. c. No, this is not a saturated model because the predictor variable has more values (the continuous variable age) than the number of parameters of the regression model (2). Point: 3 out of 3. d. The estimated mean LDL level among a population of 70 year old subjects is 126.215 mg/dL based on the model. Point: 3 out of 3. e. The estimated mean LDL level among a population of 71 year old subjects is 126.125 mg/dL based on the model. This value is the value of the mean LDL level among a population of 70 year old subjects (126.215 mg/dL) plus the slope multiplied by 1 year. Thus, the difference is the slope. Point: 3 out of 3. 2119 HW 2 f. The estimated mean LDL level among a population of 75 year old subjects is 125.764 mg/dL based on the model. This value is the value of the mean LDL level among a population of 70 year old subjects (126.215 mg/dL) plus the slope multiplied by 5 years. Thus, the difference is the slope*5. Point: 3 out of 3. g. The root mean squared is a measure of the within group standard deviation. For a robust linear regression, it is the square root of average variances across the predictor groups. Thus, the RMSE in our model indicates that the standard deviation of the mean LDL across each age group is 33.62 mg/dL. Point: 3 out of 3. h. The interpretation of the intercept is that newborns would have a mean LDL level of 132.528 mg/dL. This likely has no relevant scientific interpretation, but is merely a by product of fitting the model to the data. A newborn’s LDL is likely very low or based on the mother’s. Point: 3 out of 3. i. The interpretation of the slope is that the estimated diference in LDL for two groups differing by 1 year in age is -.09019 mg/dL, with the older group averaging a lower score. Point: 3 out of 3. j. The estimated trend in mean LDL by age is an average difference of -.09019 per one year differences in age (LDL lower in the older group). However, this trend is not significant with a p value of 0.698 and a 95% confidence interval of this difference being (-.547, .367) (which notably includes 0). This means that we fail to find statistically significant data that there is an association between LDL and age as a continuous variable. Point: 3 out of 3. k. An estimated 95% confidence interval for the difference in mean LDL across groups that differ by 5 years is (-.323, -.218). Point: 0 out of 3. l. The correlation between LDL level and age was found to be -0.0146, indicating that there is an extremely small (close to 0) negative correlation. This is similar to the regression-based conclusion which was that there is a very small non-significant trend. Point: 3 out of 3.
