ASLevelStatistics1
advertisement
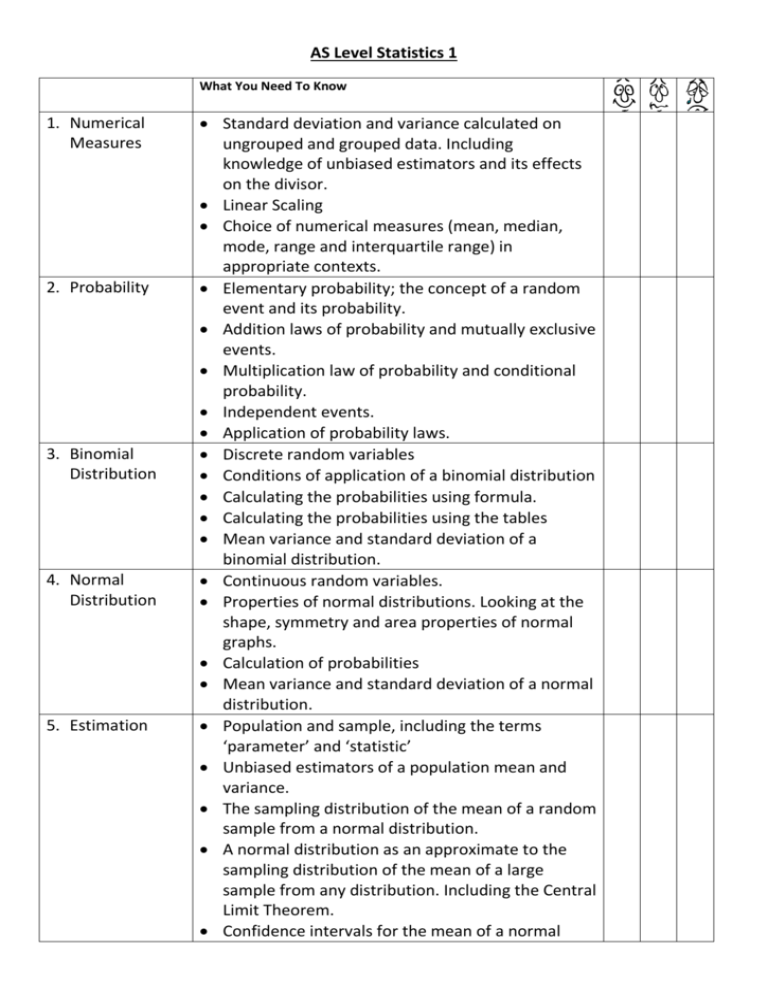
AS Level Statistics 1 What You Need To Know 1. Numerical Measures 2. Probability 3. Binomial Distribution 4. Normal Distribution 5. Estimation Standard deviation and variance calculated on ungrouped and grouped data. Including knowledge of unbiased estimators and its effects on the divisor. Linear Scaling Choice of numerical measures (mean, median, mode, range and interquartile range) in appropriate contexts. Elementary probability; the concept of a random event and its probability. Addition laws of probability and mutually exclusive events. Multiplication law of probability and conditional probability. Independent events. Application of probability laws. Discrete random variables Conditions of application of a binomial distribution Calculating the probabilities using formula. Calculating the probabilities using the tables Mean variance and standard deviation of a binomial distribution. Continuous random variables. Properties of normal distributions. Looking at the shape, symmetry and area properties of normal graphs. Calculation of probabilities Mean variance and standard deviation of a normal distribution. Population and sample, including the terms ‘parameter’ and ‘statistic’ Unbiased estimators of a population mean and variance. The sampling distribution of the mean of a random sample from a normal distribution. A normal distribution as an approximate to the sampling distribution of the mean of a large sample from any distribution. Including the Central Limit Theorem. Confidence intervals for the mean of a normal 6. Correlation and Regression distribution with know variance. Confidence intervals for the mean of a distribution using normal approximation. Inferences from confidence intervals. Calculation and interpretation of the product moment correlation coefficient. Identification of response (dependant) and explanatory (independent) variable in regression. Calculating the least square regression lines with 1 explanatory variable. Scatter diagrams and drawing regressions lines thereon. Calculation of residuals using: (𝑟𝑒𝑠𝑖𝑑𝑢𝑎𝑙)1 = 𝑦𝑖 − 𝑎−𝑏𝑥𝑖 To check model and identify outliers. Linear Scaling


