Hmwk4Soln
advertisement
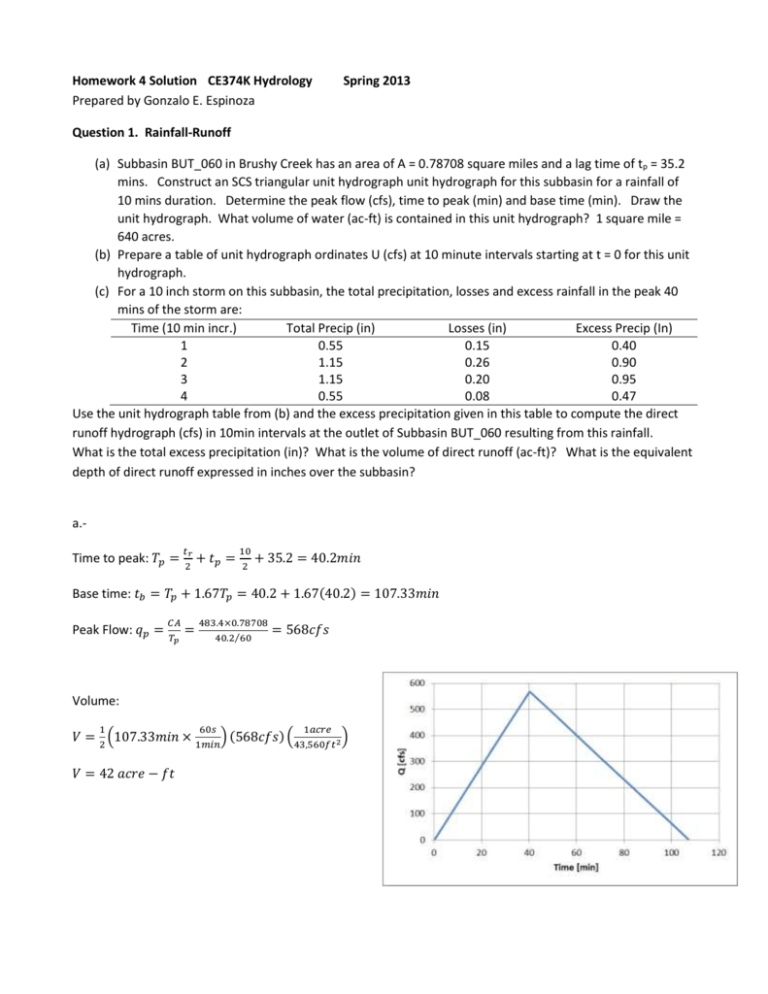
Homework 4 Solution CE374K Hydrology Prepared by Gonzalo E. Espinoza Spring 2013 Question 1. Rainfall-Runoff (a) Subbasin BUT_060 in Brushy Creek has an area of A = 0.78708 square miles and a lag time of tp = 35.2 mins. Construct an SCS triangular unit hydrograph unit hydrograph for this subbasin for a rainfall of 10 mins duration. Determine the peak flow (cfs), time to peak (min) and base time (min). Draw the unit hydrograph. What volume of water (ac-ft) is contained in this unit hydrograph? 1 square mile = 640 acres. (b) Prepare a table of unit hydrograph ordinates U (cfs) at 10 minute intervals starting at t = 0 for this unit hydrograph. (c) For a 10 inch storm on this subbasin, the total precipitation, losses and excess rainfall in the peak 40 mins of the storm are: Time (10 min incr.) Total Precip (in) Losses (in) Excess Precip (In) 1 0.55 0.15 0.40 2 1.15 0.26 0.90 3 1.15 0.20 0.95 4 0.55 0.08 0.47 Use the unit hydrograph table from (b) and the excess precipitation given in this table to compute the direct runoff hydrograph (cfs) in 10min intervals at the outlet of Subbasin BUT_060 resulting from this rainfall. What is the total excess precipitation (in)? What is the volume of direct runoff (ac-ft)? What is the equivalent depth of direct runoff expressed in inches over the subbasin? a.Time to peak: 𝑇𝑝 = 𝑡𝑟 2 + 𝑡𝑝 = 10 + 2 35.2 = 40.2𝑚𝑖𝑛 Base time: 𝑡𝑏 = 𝑇𝑝 + 1.67𝑇𝑝 = 40.2 + 1.67(40.2) = 107.33𝑚𝑖𝑛 Peak Flow: 𝑞𝑝 = 𝐶𝐴 𝑇𝑝 = 483.4×0.78708 40.2⁄60 = 568𝑐𝑓𝑠 Volume: 1 60𝑠 1𝑎𝑐𝑟𝑒 𝑉 = 2 (107.33𝑚𝑖𝑛 × 1𝑚𝑖𝑛) (568𝑐𝑓𝑠) (43,560𝑓𝑡 2 ) 𝑉 = 42 𝑎𝑐𝑟𝑒 − 𝑓𝑡 b.n [10 min] 1 2 3 4 5 6 7 8 9 10 Q [cfs/in] 141.26 282.52 423.79 565.05 484.97 400.38 315.79 231.19 146.60 62.01 c.1 Time (10 min icr.) 1 2 3 4 5 6 7 8 9 10 11 12 13 Total Excess Prec. [in] 0.40 0.90 0.95 0.47 141.26 56.50 127.13 134.20 66.39 2 3 Unit hydrograph ordinates [cfs/in] 4 5 6 7 9 10 282.52 423.79 565.05 484.97 400.38 315.79 231.19 146.6 62.01 113.01 254.27 169.52 268.39 381.41 226.02 132.78 402.60 508.55 193.99 199.18 536.80 436.47 160.15 265.57 460.72 360.34 126.32 227.94 380.36 284.21 92.48 188.18 300.00 208.07 58.64 148.42 219.63 131.94 24.80 108.66 139.27 55.81 68.90 58.91 29.14 Total Excess Precipitation: 𝑃𝑒 = 0.40 + 0.90 + 0.95 + 0.47 = 2.72𝑖𝑛 Volume of direct runoff: 𝑉𝑑𝑟 = 114.40 𝑎𝑐𝑟𝑒 − 𝑓𝑡 Equivalent depth of direct runoff: 𝑑𝑒 = 8 114.40 𝑎𝑐𝑟𝑒−𝑓𝑡 1𝑚𝑖 2 12𝑖𝑛 ( ) ( 1𝑓𝑡 ) 2 0.78708𝑚𝑖 640 𝑎𝑐𝑟𝑒𝑠 = 2.72𝑖𝑛 Direct Volume Runoff [cfs] [acre x ft] 56.50 0.78 240.14 3.31 557.98 7.69 942.22 12.98 1,237.92 17.05 1,332.60 18.36 1,212.95 16.71 984.98 13.57 754.89 10.40 524.80 7.23 303.74 4.18 127.81 1.76 29.14 0.40 114.40 Question 2. Reservoir Routing (a) For Dam 7, the elevation, storage and discharge characteristics are given in the table below. Discharge begins in the primary spillway at elevation 805 ft above datum and flow over the emergency spillway begins at elevation 829 ft above datum. Using this information, construct a table of 2S/t + Q (cfs) vs Q (cfs) for t = 3 hours. Elevation (ft) 805 807 809 811 813 815 817 819 821 823 825 827 829 829.75 830.5 831.85 833.5 836.5 840.25 844 Storage (Acft) 0.00 109.22 238.13 385.61 561.82 772.75 1,031.46 1,307.01 1,608.38 1,967.20 2,353.04 2,775.92 3,243.88 3,430.94 3,631.02 4,002.88 4,501.40 5,510.77 7,008.94 8,692.70 Discharge (cfs) 0.00 94.57 98.89 102.83 106.61 110.29 113.80 117.22 120.57 123.81 126.97 130.05 133.07 387.16 922.26 2,486.81 5,186.03 14,100.09 81,641.54 201,496.45 2S/∆t + Q (cfs) 0.00 975.61 2,019.81 3,213.42 4,638.62 6,343.81 8,434.24 10,660.43 13,094.84 15,992.56 19,108.16 22,522.47 26,300.37 28,063.41 30,212.49 34,776.71 41,497.32 58,553.63 138,180.32 271,617.56 250,000 Discharge (cfs) 200,000 150,000 100,000 50,000 0 0 50,000 100,000 150,000 200,000 2S/∆t + Q (cfs) 250,000 300,000 (b) The inflow hydrograph to Dam 7 is given below. Determine the resulting time distributions of the storage (ac-ft) and elevation (ft) in Dam 7 and discharge (cfs) from Dam 7 for time 0 to 36 hours. What is the peak elevation? What is the peak discharge? Does water flow over the emergency spillway? Time (hrs) 0 3 6 9 12 15 18 21 24 27 30 33 36 Inflow (cfs) 0.0 123.2 230.3 485.9 3,534.3 4,914.9 1,742.6 1,270.1 1,048.1 506.5 239.3 148.8 102.4 Ij+Ij+1 (cfs) 123.2 353.5 716.2 4,020.2 8,449.2 6,657.5 3,012.7 2,318.2 1,554.6 745.8 388.1 251.2 2Sj/Δt -Qj 0.0 99.3 365.0 891.2 4,697.0 12,905.0 19,307.7 22,060.7 24,115.8 25,405.3 25,885.2 26,007.2 25,992.3 Peak Elevation: 828.99 ft Peak Discharge: 133.05 cfs The water does not flow over the emergency spillway. 2Sj+1/Δt +Qj+1 123.2 452.8 1,081.2 4,911.4 13,146.2 19,562.5 22,320.4 24,378.9 25,670.4 26,151.1 26,273.3 26,258.4 Elevation (ft) 805.00 805.25 805.93 807.20 813.32 821.04 825.27 826.88 827.98 828.67 828.92 828.99 828.98 Outflow Q (cfs) 0.00 11.94 43.89 95.01 107.20 120.63 127.38 129.87 131.53 132.57 132.95 133.05 133.04 Question 3. Channel Flow Reach SBR_080 in Brushy Creek has a length of 1545 ft, a slope of 0.0008 ft/ft, a Manning’s “n” of 0.1 and a cross-section defined by the coordinates in the table below where Station means distance from the left hand side of the channel, looking downstream. Station(ft) 0.00 118.10 236.20 284.00 304.00 323.42 344.26 365.10 Elevation (ft) 797.61 790.07 781.67 777.07 777.07 783.57 789.86 795.48 For elevations of h = 777, 780, 785, 790, 795 ft above datum, determine the corresponding water depth, y (ft), wetted perimeter, P (ft), cross-sectional area, A (ft2), hydraulic radius, R (ft), flow velocity V (ft/s), discharge Q (cfs), and kinematic wave celerity Ck (ft/s). SUMMARY Parameter Water depth (ft): Wetted perimeter (ft): Cross-sectional area (ft^2): Hydraulic radius (ft): Flow velocity (ft/s): Discharge (cfs): Kinematic wave celerity (ft/s): 777 ft 0.00 0.00 0.00 0.00 0.00 0.00 0.00 780 ft 2.93 87.53 157.08 1.79 0.62 97.76 1.04 Case 785 ft 790 ft 7.93 12.93 227.54 249.50 730.14 1,516.50 3.21 6.08 0.92 1.40 669.43 2,128.57 1.53 2.34 795 ft 17.93 368.33 2,986.39 8.11 1.70 5,079.41 2.83 Case: 777 ft Station(ft) 0.00 118.10 236.20 284.00 304.00 323.42 344.26 365.10 Elevation (ft) 797.61 790.07 781.67 777.07 777.07 783.57 789.86 795.48 Water depth (ft) 0.00 0.00 0.00 0.00 0.00 0.00 0.00 0.00 Width (ft) Mean Water depth (ft) 118.10 118.10 47.80 20.00 19.42 20.84 20.84 Area (ft^2) Wet Perimeter (ft) 0.00 0.00 0.00 0.00 0.00 0.00 0.00 0.00 0.00 0.00 0.00 0.00 0.00 0.00 0.00 0.00 0.00 0.00 0.00 0.00 0.00 ∑ 0.00 0.00 Water depth (ft): Wetted perimeter (ft): Cross-sectional area (ft^2): Hydraulic radius (ft): Flow velocity (ft/s): Discharge (cfs): Kinematic wave celerity (ft/s): 0.00 0.00 0.00 0.00 0.00 0.00 0.00 Case: 780 ft Station(ft) 0.00 118.10 236.20 284.00 304.00 323.42 344.26 365.10 Elevation (ft) 797.61 790.07 781.67 777.07 777.07 783.57 789.86 795.48 Water depth (ft) 0.00 0.00 0.00 2.93 2.93 0.00 0.00 0.00 Width (ft) 118.10 118.10 47.80 20.00 19.42 20.84 20.84 Mean Water depth (ft) Area (ft^2) Wet Perimeter (ft) 0.00 0.00 1.46 2.93 1.46 0.00 0.00 0.00 0.00 70.03 58.60 28.45 0.00 0.00 0.00 0.00 47.89 20.00 19.64 0.00 0.00 ∑ 157.08 87.53 Water depth (ft): Wetted perimeter (ft): Cross-sectional area (ft^2): Hydraulic radius (ft): Flow velocity (ft/s): Discharge (cfs): Kinematic wave celerity (ft/s): 2.93 87.53 157.08 1.79 0.62 97.76 1.04 Case: 785 ft Station(ft) 0.00 118.10 236.20 284.00 304.00 323.42 344.26 365.10 Elevation (ft) 797.61 790.07 781.67 777.07 777.07 783.57 789.86 795.48 Water depth (ft) 0.00 0.00 3.33 7.93 7.93 1.43 0.00 0.00 Width (ft) 118.10 118.10 47.80 20.00 19.42 20.84 20.84 Mean Water depth (ft) Area (ft^2) Wet Perimeter (ft) 0.00 1.67 5.63 7.93 4.68 0.71 0.00 0.00 196.64 269.11 158.60 90.89 14.90 0.00 0.00 118.15 48.02 20.00 20.48 20.89 0.00 ∑ 730.14 227.54 Water depth (ft): Wetted perimeter (ft): Cross-sectional area (ft^2): Hydraulic radius (ft): Flow velocity (ft/s): Discharge (cfs): Kinematic wave celerity (ft/s): 7.93 227.54 730.14 3.21 0.92 669.43 1.53 Case: 790 ft Station(ft) 0.00 118.10 236.20 284.00 304.00 323.42 344.26 365.10 Elevation (ft) 797.61 790.07 781.67 777.07 777.07 783.57 789.86 795.48 Water depth (ft) 0.00 0.00 8.33 12.93 12.93 6.43 0.14 0.00 Width (ft) 118.10 118.10 47.80 20.00 19.42 20.84 20.84 Mean Water depth (ft) Area (ft^2) Wet Perimeter (ft) 0.00 4.17 10.63 12.93 9.68 3.28 0.07 0.00 491.89 508.11 258.60 187.99 68.46 1.46 0.00 118.39 48.02 20.00 20.48 21.77 20.84 ∑ 1,516.50 249.50 Water depth (ft): Wetted perimeter (ft): Cross-sectional area (ft^2): Hydraulic radius (ft): Flow velocity (ft/s): Discharge (cfs): Kinematic wave celerity (ft/s): 12.93 249.50 1,516.50 6.08 1.40 2,128.57 2.34 Case: 795 ft Station(ft) 0.00 118.10 236.20 284.00 304.00 323.42 344.26 365.10 Elevation (ft) 797.61 790.07 781.67 777.07 777.07 783.57 789.86 795.48 Water depth (ft) 0.00 4.93 13.33 17.93 17.93 11.43 5.14 0.00 Width (ft) 118.10 118.10 47.80 20.00 19.42 20.84 20.84 Mean Water depth (ft) Area (ft^2) Wet Perimeter (ft) 2.46 9.13 15.63 17.93 14.68 8.28 2.57 291.12 1,078.25 747.11 358.60 285.09 172.66 53.56 118.20 118.40 48.02 20.00 20.48 21.77 21.46 ∑ 2,986.39 368.33 Water depth (ft): Wetted perimeter (ft): Cross-sectional area (ft^2): Hydraulic radius (ft): Flow velocity (ft/s): Discharge (cfs): Kinematic wave celerity (ft/s): 17.93 368.33 2,986.39 8.11 1.70 5,079.41 2.83
