Meteorology Assign. 2
advertisement
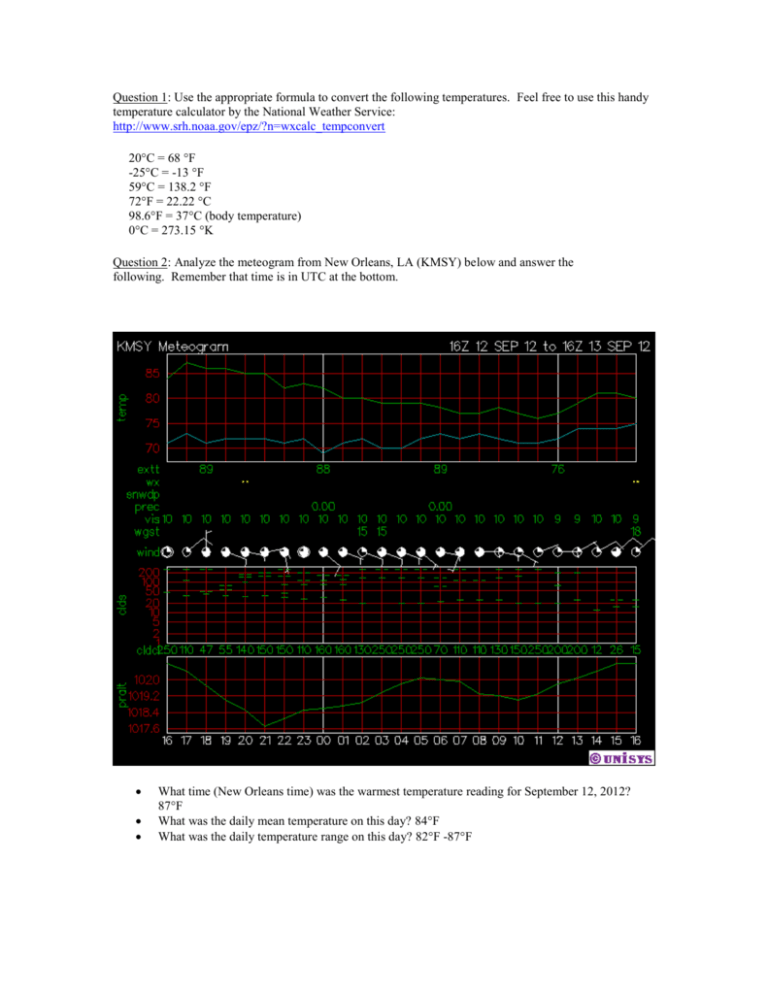
Question 1: Use the appropriate formula to convert the following temperatures. Feel free to use this handy temperature calculator by the National Weather Service: http://www.srh.noaa.gov/epz/?n=wxcalc_tempconvert 20°C = 68 °F -25°C = -13 °F 59°C = 138.2 °F 72°F = 22.22 °C 98.6°F = 37°C (body temperature) 0°C = 273.15 °K Question 2: Analyze the meteogram from New Orleans, LA (KMSY) below and answer the following. Remember that time is in UTC at the bottom. What time (New Orleans time) was the warmest temperature reading for September 12, 2012? 87°F What was the daily mean temperature on this day? 84°F What was the daily temperature range on this day? 82°F -87°F Question 3: Next you are going to analyze yearly temperature means and ranges for specific locations around the world. NOTE: Think of the controls of temperature (i.e. latitude, land/water distribution, ocean currents, altitude, geographic location) and how that might influence the temperature of these locations. Salt Lake City, Utah (Continental interior location) Jan 28 Feb 34 Mar 40 April 50 Yearly Mean Temperature Yearly Temperature Range May 58 Jun 67 Jul 76 Aug 74 Sept 65 Oct 53 Nov 38 Dec 32 Jun 68 Jul 70 Aug 73 Sept 72 Oct 65 Nov 63 Dec 59 Jun 80 Jul 82 Aug 82 Sept 81 Oct 77 Nov 70 Dec 68 Jul 60 Aug 55 Sept 44 Oct 26 Nov 4 Dec .7 Jul 66 Aug 63 Sept 52 Oct 40 Nov 29 Dec 20 51.25 28 - 76 Los Angeles, California (Coastal location) Jan 55 Feb 57 Mar 59 April 59 Yearly Mean Temperature Yearly Temperature Range May 64 63.66 55 - 73 Miami, Florida (Coastal location) Jan 66 Feb 68 Mar 70 April 73 Yearly Mean Temperature Yearly Temperature Range May 77 74.5 66 - 82 Fairbanks, Alaska (Coastal location near arctic) Jan -11 Feb 0.5 Mar 10 April 27 Yearly Mean Temperature Yearly Temperature Range May 47 Jun 59 26.85 -11 - 60 Moscow, Russia (Continental interior location) Jan 14 Feb 15 Mar 24 April 40 Yearly Mean Temperature Yearly Temperature Range May 53 Jun 62 39.83 14 - 66 McMurdo Station, Antarctica (Continental interior location in Southern Hemisphere) Jan 24 Feb 15 Mar 5 April -9 May -11 Jun -12 Jul -15 Aug -15 Sept -12 Oct -2 Nov 14 Dec 25 Yearly Mean Temperature Yearly Temperature Range .58 -15 - 25 Benghazi, Libya (Continental interior location in Sahara Desert of Africa) Jan 55 Feb 57 Mar 63 April 66 Yearly Mean Temperature Yearly Temperature Range May 72 Jun 75 Jul 78 Aug 79 Sept 78 Oct 75 Nov 66 Dec 59 68.58 55 - 79 Question 4: Go to NOAA’s website at http://www.ncdc.noaa.gov/oa/climate/globalextremes.html#hightemp to analyze historical temperature and precipitation extremes globally. List the three hottest places ever recorded in the world. Continent Temperature Place Elevation Date Africa 136 El Azizia, Libya 367 9/13/1922 North America 134 Death Valley, CA -178 7/10/1913 Asia 129 Tirat Tsvi, Israel -722 6/22/1942 List the three coldest places ever recorded around the world. Continent Antarctica Asia Asia Temperature -129 -90 -90 Place Vostok Oimekon, Russia Verkhoyansk, Russia Elevation 11220 2625 350 Date 7/21/1983 2/6/1933 2/7/1892 Question 5: The heat index and wind chill is a way to compare temperature in relation to human senses. The heat index compares the relationship between temperature and humidity. The warmer the temperature and the higher the humidity, the hotter it will “feel” to humans. Go to http://www.srh.noaa.gov/jetstream/global/hi.htm to analyze heat waves. 1. 2. Temperature = 100°F & Relative Humidity = 40% => Apparent Temperature = 110°F Temperature = 100°F & Relative Humidity = 60% => Apparent Temperature = 130°F Question 6: The wind chill compares temperature with wind speed. The faster the wind blows, the colder it will feel. Go to http://www.srh.noaa.gov/jetstream/global/chill.htm to analyze wind chills. Temperature = 30°F & Wind Speed = 0 mph => Wind Chill = 30°F Temperature = 30°F & Wind Speed = 15 mph => Wind Chill = 19°F Temperature = 15°F & Wind Speed = 20 mph => Wind Chill = -2°F Temperature = 0°F & Wind Speed = 20 mph => Wind Chill = -22°F Question 7: Finally, you are going to verify a 24-hour forecast of surface temperature. Analyze the 24-hour national forecast for high temperatures and low temperatures. High Temperature: http://images.intellicast.com/National/Temperature/HighTomorrow.aspx Low Temperature: http://images.intellicast.com/National/Temperature/LowTomorrow.aspx Determine a location on the map you would like and find a Station ID for that location. Find a Station ID for your chosen location at http://www.rap.ucar.edu/weather/surface/stations.txt. Remember, it should be a four-letter code usually starting with the letter “K” if it is within the lower-48 states. 1. 2. 3. What is your chosen location (city and state)? Eugene, OR What is its station ID? KEUG Right click on the high temperature image and select “Save Picture As…” or “Save Image As…” and save the image to your computer. Save your high temperature map as HighTemperature and your low temperature map as LowTemperature. The weather model forecasts the high temperature to be 47°F and the low temperature to be 38°F. Label appropriately with the degrees Fahrenheit. You will upload these images into your SLCC ePortfolio. 4. 5. Now wait 24 hours. Once 24 hours have passed, go to the NWS climate website at http://www.nws.noaa.gov/climate/. You will see a map of temperature readings; click on your location (or the closest one to your chosen location). Clicking on your location will bring up a new website (allow for pop-ups). Make sure the Product is the Daily Climate Report, the Location is your chosen city, and the Time Frame is one day (not more or less) after you looked at the high/low temperature forecast. Click GO. What was the maximum temperature and time for your chosen location? 52°F What was the minimum temperature and time for your chosen location? 37°F What was the average temperature for your chosen location? 45°F Assignment Reflection Write a 200-250 word response total for the reflection question posted below. Your reflection also needs to be posted in your SLCC ePortfolio along with this assignment. In what ways have you improved - so far - as a scientific thinker. What brought about those improvements? If not, explain why. Point to specific experiences, readings, assignments, or discussions in this course. I have already started to look at weather, and really everything else around me, in a much more scientific way than before I started this class. I have realized that many of my assumptions about weather and weather forecasting were wrong and that there are a lot more things at play than I previously realized. One of the first things that I found really interesting was the information about ozone depletion in Chapter One. I have, along with most other people, heard a lot about the hole in the ozone layer but I didn’t know a lot about the science behind this. I knew it was a big problem and took scientists at their word when they said that human actions have a huge influence on this. I enjoyed learning about what is actually happening to the ozone and had not previously realized that there is such a large fluctuation in the size of the ozone hole, depending on what time of year it is. In Chapter Two I found it really interesting when they explained the reason that tile feels colder to the touch than carpet, because tile is a better conductor. Now that I have thought about it and learned more about heat conduction it makes sense but I had never really considered it previously. I like that I am learning answers to every day questions, some that I didn’t even know to ask before.
