V9.1 SAS System Output
advertisement
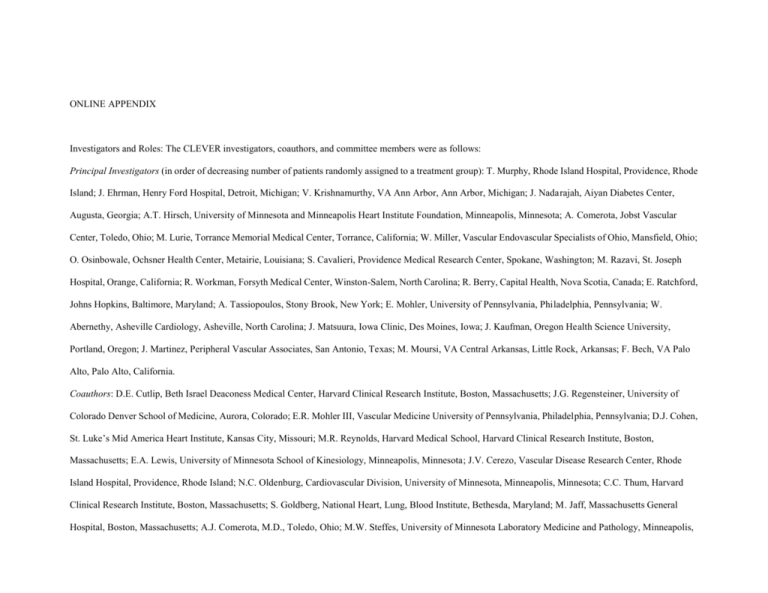
1 ONLINE APPENDIX Investigators and Roles: The CLEVER investigators, coauthors, and committee members were as follows: Principal Investigators (in order of decreasing number of patients randomly assigned to a treatment group): T. Murphy, Rhode Island Hospital, Providence, Rhode Island; J. Ehrman, Henry Ford Hospital, Detroit, Michigan; V. Krishnamurthy, VA Ann Arbor, Ann Arbor, Michigan; J. Nadarajah, Aiyan Diabetes Center, Augusta, Georgia; A.T. Hirsch, University of Minnesota and Minneapolis Heart Institute Foundation, Minneapolis, Minnesota; A. Comerota, Jobst Vascular Center, Toledo, Ohio; M. Lurie, Torrance Memorial Medical Center, Torrance, California; W. Miller, Vascular Endovascular Specialists of Ohio, Mansfield, Ohio; O. Osinbowale, Ochsner Health Center, Metairie, Louisiana; S. Cavalieri, Providence Medical Research Center, Spokane, Washington; M. Razavi, St. Joseph Hospital, Orange, California; R. Workman, Forsyth Medical Center, Winston-Salem, North Carolina; R. Berry, Capital Health, Nova Scotia, Canada; E. Ratchford, Johns Hopkins, Baltimore, Maryland; A. Tassiopoulos, Stony Brook, New York; E. Mohler, University of Pennsylvania, Philadelphia, Pennsylvania; W. Abernethy, Asheville Cardiology, Asheville, North Carolina; J. Matsuura, Iowa Clinic, Des Moines, Iowa; J. Kaufman, Oregon Health Science University, Portland, Oregon; J. Martinez, Peripheral Vascular Associates, San Antonio, Texas; M. Moursi, VA Central Arkansas, Little Rock, Arkansas; F. Bech, VA Palo Alto, Palo Alto, California. Coauthors: D.E. Cutlip, Beth Israel Deaconess Medical Center, Harvard Clinical Research Institute, Boston, Massachusetts; J.G. Regensteiner, University of Colorado Denver School of Medicine, Aurora, Colorado; E.R. Mohler III, Vascular Medicine University of Pennsylvania, Philadelphia, Pennsylvania; D.J. Cohen, St. Luke’s Mid America Heart Institute, Kansas City, Missouri; M.R. Reynolds, Harvard Medical School, Harvard Clinical Research Institute, Boston, Massachusetts; E.A. Lewis, University of Minnesota School of Kinesiology, Minneapolis, Minnesota; J.V. Cerezo, Vascular Disease Research Center, Rhode Island Hospital, Providence, Rhode Island; N.C. Oldenburg, Cardiovascular Division, University of Minnesota, Minneapolis, Minnesota; C.C. Thum, Harvard Clinical Research Institute, Boston, Massachusetts; S. Goldberg, National Heart, Lung, Blood Institute, Bethesda, Maryland; M. Jaff, Massachusetts General Hospital, Boston, Massachusetts; A.J. Comerota, M.D., Toledo, Ohio; M.W. Steffes, University of Minnesota Laboratory Medicine and Pathology, Minneapolis, 2 Minnesota; I.H. Abrahamsen, M.S., Boston, Massachusetts; A.T. Hirsch, Vascular Medicine Program, Lillehei Heart Institute, Cardiovascular Division, University of Minnesota Medical School, Minneapolis, Minnesota. Steering Committee: A.T. Hirsch (chair), T.P. Murphy, J.G. Regensteiner, M. Jaff, D.J. Cohen, A.J. Comerota, D.E. Cutlip, E.R. Mohler, E.A. Lewis, M.W. Steffes, S. Goldberg. Exercise Training Committee: J.G. Regensteiner (chair), E.A. Lewis, A. Ershaw, D. Treat-Jacobson, T. Collins, D. Badenhop, J.K. Ehrman, M.E. Walsh, U. Bronas, N.C. Oldenburg. Data and Safety Monitoring Board: T.A. Pearson (chair), B.H. Annex, M. Hlatky, M.T. Hughes, M.M. Brooks, R.J. Powell, A. Roberts, J.A. Vita. Online Supplemental Table 1. Change from baseline to 6 months - By treatments Supervised Exercise Only ' PWT COT Patients with 18m follow-up N=34 5.7±4.3 (34) 2.9±2.8 (34) Patients without 18m follow-up N=9 6.9±8.8 (3) 3.3±3.6 (3) 95% CI -1.2[-11.2,8.8] -0.4[-4.6,3.7] P-Value* 0.835 0.809 P-Value** 0.6122 0.8271 P-Value* 0.049 0.266 P-Value** 0.0478 0.0259 Stent Only ' PWT COT Patients with 18m follow-up N=37 3.2±4.3 (35) 3.0±3.0 (35) Patients without 18m follow-up N=9 7.7±7.1 (5) 7.8±8.2 (5) 95% CI -4.5[-10.9,1.8] -4.8[-12.1,2.5] Optimal Medical Care 3 ' PWT COT Patients with 18m follow-up N=15 1.1±3.0 (15) 0.7±1.1 (15) Patients without 18m follow-up N=7 1.5±1.2 (5) 0.7±1.3 (5) 95% CI -0.3[-2.2,1.5] -0.0[-1.3,1.2] P-Value* 0.810 0.955 P-Value** 0.8373 0.9569 * P-values are calculated using t-test. ** P-values are calculated using change scores. P-values are based on analysis of covariance adjusting for study center, baseline cilostazol use, and baseline value of the endpoint.
