Algebra 1: Data Analysis Name: Measures of Variance, IQR, Box
advertisement

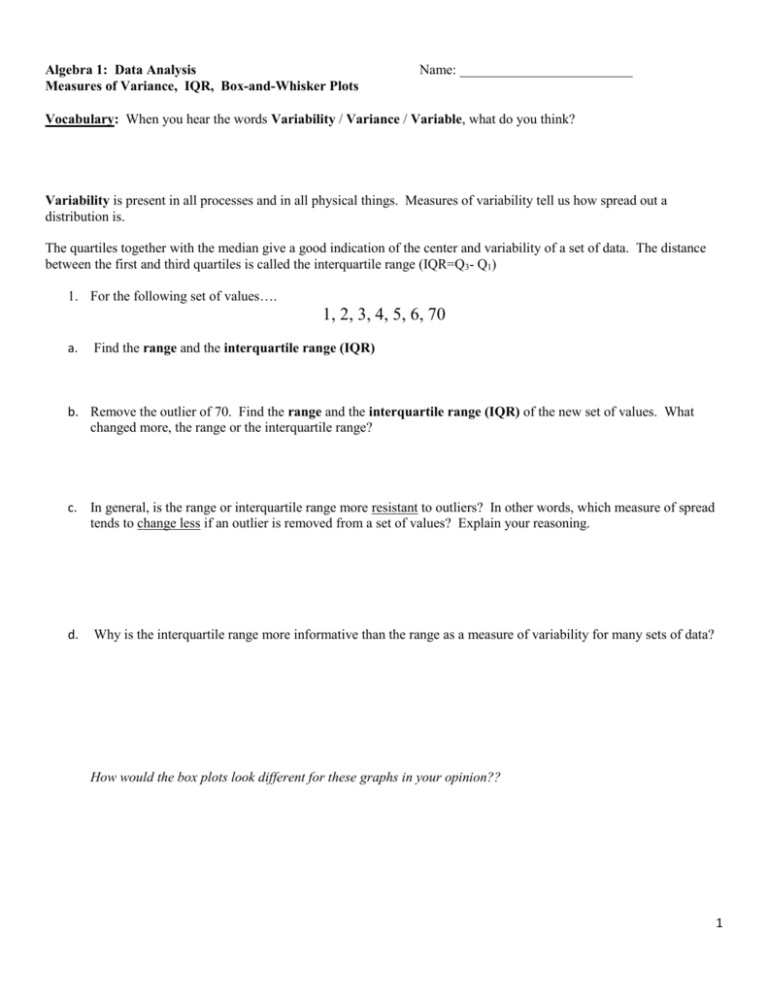
Algebra 1: Data Analysis Measures of Variance, IQR, Box-and-Whisker Plots Name: _________________________ Vocabulary: When you hear the words Variability / Variance / Variable, what do you think? Variability is present in all processes and in all physical things. Measures of variability tell us how spread out a distribution is. The quartiles together with the median give a good indication of the center and variability of a set of data. The distance between the first and third quartiles is called the interquartile range (IQR=Q3- Q1) 1. For the following set of values…. 1, 2, 3, 4, 5, 6, 70 a. Find the range and the interquartile range (IQR) b. Remove the outlier of 70. Find the range and the interquartile range (IQR) of the new set of values. What changed more, the range or the interquartile range? c. In general, is the range or interquartile range more resistant to outliers? In other words, which measure of spread tends to change less if an outlier is removed from a set of values? Explain your reasoning. d. Why is the interquartile range more informative than the range as a measure of variability for many sets of data? How would the box plots look different for these graphs in your opinion?? 1 2. Box plots are most useful when then distribution is skewed or has outliers or if you want to compare two or more distributions. The math homework grades for five ninth-grade students at Lakeview High School – Maria (M) Tran(T), Gia (G), Jack (J), and Susan (S) – are shown with corresponding box plots Maria’s Grades 8,9,6,7,9,8,8,6,9,9,8,7,8,7,9,9,7,7,8,9 Tran’s Grades 9,8,6,9,7,9,8,4,8,5,9,9,9,6,4,6,5,8,8,8 Gia’s Grades 8,9,9,9,6,9,8,6,8,6,8,8,8,6,6,6,3,8,8,9 Jack’s Grades 10,7,7,9,5,8,7,4,7,5,8,8,8,4,5,6,5,8,7 Susan’s Grades 8,8,7,9,7,8,8,6,8,7,8,8,8,7,8,8,10,9,9,9 a) Make a box plot for Susan’s homework grades on the graph above. b) Why do the plots for Maria and Tran have NO whisker at the upper end? c) i. Why is the lower whisker on Gia’s box plot so long? Explain. ii. Does this mean there are more grades for Gia in that whisker than in the shorter whisker? Explain. d) i. Which distribution is MOST symmetric? How do you know? ii. Which distributions are skewed to the left? How do you know? e) Use the box plots to determine which students have the smallest and largest interquartile ranges. i. Smallest IQR: _______________________ Largest IQR: ___________________________ ii. Does the student with the smallest interquartile range also have the smallest range? Show your work. iii. Does the student with the largest interquartile range also have the largest range? Show your work. f) Based on the box plots, which of the five students seems to have the best record? Why? Back up your choice with specific statistical measurements! 2 3. Resting pulse rates have a lot of variability from person to person. In fact, rates between 60 and 100 are considered normal. For a highly conditioned athlete, “normal can be as low as 40 beats per minute. a) Take your pulse for 20 seconds, triple it, and record your pulse rate (in number of beats per minute). b) If you are able, do some mile exercise for 3 or 4 minutes as your teacher times you. Then take your pulse for 20 seconds, triple it, and records this exercising pulse rate (in number of beats per minute). Collect the results from all students in your class, keeping the data as ordered pairs, (resting, exercising) for each student. c) Find the five-number summary of resting pulse rates for your class. Repeat this for the exercising pulse rates. Resting: Min: _____ Q1: _______ Median: ____ Q3: ______ Max: _______ Exercising: Min: _____ Q1: _______ Median: ____ Q3: ______ Max: _______ d) Draw box plots of the resting and exercising pulse rates for your class on the same number line. Label the scale. e) Compare the shapes, centers and variability of the two distributions. Give specific statements. f) What information is lost when you make two box plots for the resting and exercising pulse rates for the same people? 3 Identifying Outliers – USING MATH!!! NOW IT’S NOT A GUESSING GAME / ESTIMATE!! To determine if there are any outliers: - Multiply the IQR by 1.5 Visually: - Add that value to Q3, any number larger than this is an outlier - Subtract the value from Q1, any number small than this is an outlier. 4. Below is the dot plot of lengths of female bears. a. Do there appear to be any outliers in the data just by looking at the graph? n = 44 b. The five number summary for the lengths of female bears is min: = 36, Q1 = 56.5, Q2= 59, Q3 = 61.5 Max = 70 i. Make a box plot for this data. 5. ii. Are there any outliers on the high end? Prove mathematically. iii. Are there any outliers on the low end? Prove mathematically. Which of the following box plots is for a set of data that has an outlier? Show your work to prove! A. B. C. D. E. 4 6. The table at the right shows the total points scored during the first eight years of the NBA careers of Kareem Abdul-Jabbar and Michael Jordan. a. Which player had the higher mean number of points per year? b. What summary statistics could you use to measure consistency in a player? c. Make a box and whisker plot for each player. Show the number line below the plots so the scale is the same! d. Which player was more consistent according to each of your statistics? Explain how you chose! e. Determine if there are any outliers for either player. Show the proof mathematically. f. Jordan had an injury in 1986. If you ignore his performance for that year, how would you change your answers to parts a and c? 5 7. Consider the box plot to the right. a. What does the “n=20” below the plot mean? b. About how many scores are between 50 and 80? c. About how many scores are between 80 and 100? d. About how many scores are greater than 80? e. Is it possible for the box plot to be displaying the scores shown below? Explain your reasoning. 50,60,60,75,80,80,82,83,85,90,90,91,91,94,95,95,98,100,106,110 f. Create a set of scores that could be the ones displayed by this box plot. 8. The box plots to the right represents the amounts of money (in dollars) carried by the people surveyed in four difference places at the mall. a. Which group of people has the smallest range? The largest? b. Which group of people has the smallest interquartile range? The largest? c. Which group of people has the largest median amount of money? d. Which distribution is most symmetric? e. Which group of people do you think might be high school students standing in line for tickets at a movie theater on Saturday night? Explain your reasoning. f. Do any groups have outliers? If so, tell which group has an outlier and what the outlier is. Justify your answer by showing the mathematical process! HOMEWORK - Finish MathXL too!! 6


