Lab 4
advertisement
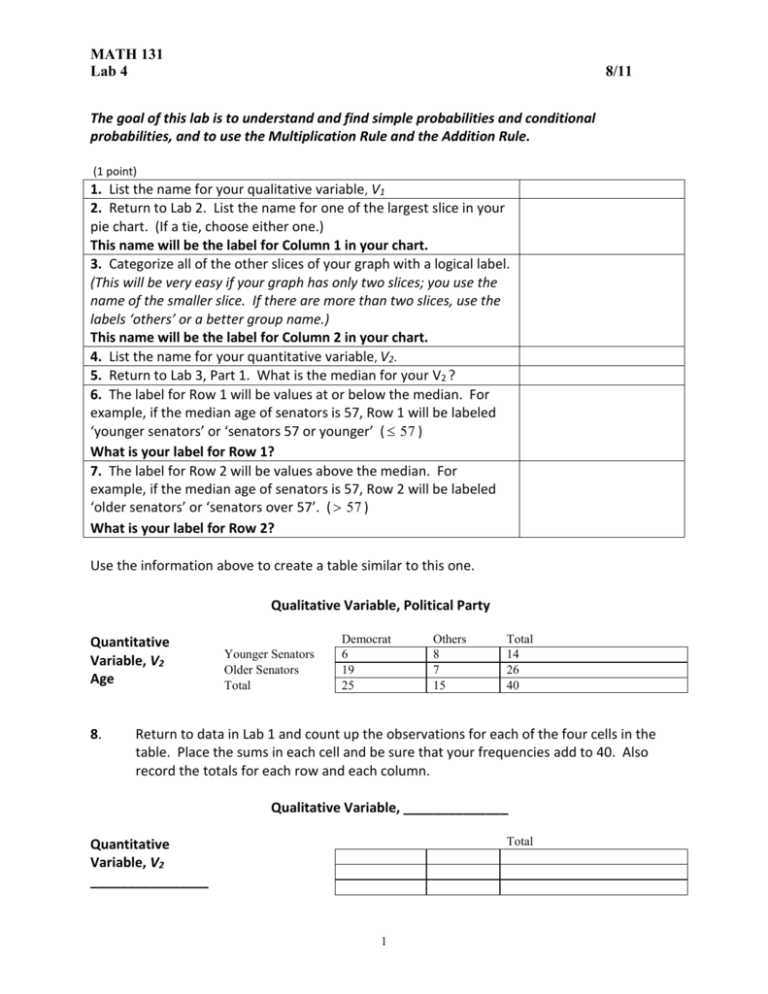
MATH 131 Lab 4 8/11 The goal of this lab is to understand and find simple probabilities and conditional probabilities, and to use the Multiplication Rule and the Addition Rule. (1 point) 1. List the name for your qualitative variable, V1 2. Return to Lab 2. List the name for one of the largest slice in your pie chart. (If a tie, choose either one.) This name will be the label for Column 1 in your chart. 3. Categorize all of the other slices of your graph with a logical label. (This will be very easy if your graph has only two slices; you use the name of the smaller slice. If there are more than two slices, use the labels ‘others’ or a better group name.) This name will be the label for Column 2 in your chart. 4. List the name for your quantitative variable, V2. 5. Return to Lab 3, Part 1. What is the median for your V2 ? 6. The label for Row 1 will be values at or below the median. For example, if the median age of senators is 57, Row 1 will be labeled ‘younger senators’ or ‘senators 57 or younger’ ( 57 ) What is your label for Row 1? 7. The label for Row 2 will be values above the median. For example, if the median age of senators is 57, Row 2 will be labeled ‘older senators’ or ‘senators over 57’. ( 57 ) What is your label for Row 2? Use the information above to create a table similar to this one. Qualitative Variable, Political Party Quantitative Variable, V2 Age 8. Younger Senators Older Senators Total Democrat 6 19 25 Others 8 7 15 Total 14 26 40 Return to data in Lab 1 and count up the observations for each of the four cells in the table. Place the sums in each cell and be sure that your frequencies add to 40. Also record the totals for each row and each column. Qualitative Variable, ______________ Total Quantitative Variable, V2 _________________ 1 MATH 131 Lab 4 (2 points) 8/11 Find simple probabilities. 9. Compute the probability of being in Row 1. Use the language of your data. (For 14 example, P(Younger senators) = 0.350 ). 40 10. Compute the probability of being in Row 2. Use the language of your data. (For 26 0.650 ). example, P(Older senators) = 40 11. Compute the probability of being in Column 1. Use the language of your data. (For 25 0.625 ). example, P(Democrat) = 40 12. Compute the probability of being in Row 1 and Column 1 using the appropriate frequency from your table. Use the language of your data. (For example, P(Democrat 6 0.150 ). and younger) = 40 (3 points) 13. 14. Find conditional probabilities. Find the probability of being in Row 1, given Column 1. Use the language of your data. (a) Comparing the probability in # 13 to the probability in # 9, decide if Rows and Columns are independent. (b) Clearly explain your reasoning, using a complete sentence and one of these phrases: equally likely, more likely or less likely. Example 13. P(Younger, given Democrat) = Your Data 13. 6 0.240 25 14. 14. P(Younger) = 0.350 Since P(Younger, given Democrat) is less than P(Younger), Democrats are less likely to be younger. These are dependent events. 2 MATH 131 Lab 4 15. 16. 8/11 Find the probability of being in Column 1, given Row 2. Use the language of your data. (For example, P(Democrat, given Older). Comparing the probability in #15 to the probability in #11, determine if Rows and Columns are independent. Clearly explain your reasoning, using a complete sentence and one of these phrases: equally likely, more likely or less likely. Example 15. P(Democrat, given Older) = Your Data 15. 19 0.731 26 16. 16. P(Democrat) = 0.625 Since P(Democrat, given Older) is higher than P(Democrat), Older Senators are more likely to be Democrats. These are dependent events. Multiplication Rule (1 point) 17. If you choose two subjects from your sample, use the Multiplication Rule to find the probability that they are both from Column 1. Example Your Data P(Both Democrats) = 17. P(Democrat and Democrat) = 25 24 =0.385 40 39 Addition Rule Use the Addition Rule to find the probability of being in Row 1 or Column 1. Use the Addition Rule to find the probability of being in Row 1 or Row 2. (3 points) 18. 19. Example 18. P(Younger or Democrat ) = 14 25 6 0.825 40 40 40 19. P(Younger or Older) = 20. Your Data 18. 19. 14 26 1 40 40 Consider your last two answers and list two mutually exclusive events for your data. Explain your reasoning. 3

