Biomass Analysis and Screening for Fuel Applications
advertisement
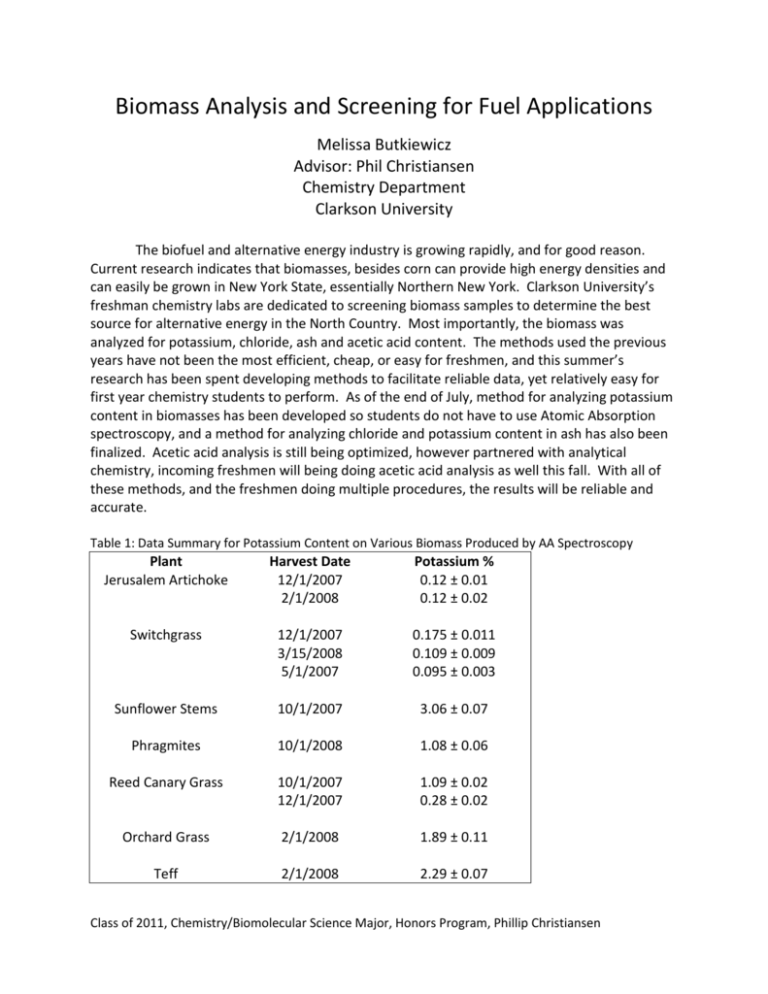
Biomass Analysis and Screening for Fuel Applications Melissa Butkiewicz Advisor: Phil Christiansen Chemistry Department Clarkson University The biofuel and alternative energy industry is growing rapidly, and for good reason. Current research indicates that biomasses, besides corn can provide high energy densities and can easily be grown in New York State, essentially Northern New York. Clarkson University’s freshman chemistry labs are dedicated to screening biomass samples to determine the best source for alternative energy in the North Country. Most importantly, the biomass was analyzed for potassium, chloride, ash and acetic acid content. The methods used the previous years have not been the most efficient, cheap, or easy for freshmen, and this summer’s research has been spent developing methods to facilitate reliable data, yet relatively easy for first year chemistry students to perform. As of the end of July, method for analyzing potassium content in biomasses has been developed so students do not have to use Atomic Absorption spectroscopy, and a method for analyzing chloride and potassium content in ash has also been finalized. Acetic acid analysis is still being optimized, however partnered with analytical chemistry, incoming freshmen will being doing acetic acid analysis as well this fall. With all of these methods, and the freshmen doing multiple procedures, the results will be reliable and accurate. Table 1: Data Summary for Potassium Content on Various Biomass Produced by AA Spectroscopy Plant Jerusalem Artichoke Harvest Date 12/1/2007 2/1/2008 Potassium % 0.12 ± 0.01 0.12 ± 0.02 Switchgrass 12/1/2007 3/15/2008 5/1/2007 0.175 ± 0.011 0.109 ± 0.009 0.095 ± 0.003 Sunflower Stems 10/1/2007 3.06 ± 0.07 Phragmites 10/1/2008 1.08 ± 0.06 Reed Canary Grass 10/1/2007 12/1/2007 1.09 ± 0.02 0.28 ± 0.02 Orchard Grass 2/1/2008 1.89 ± 0.11 Teff 2/1/2008 2.29 ± 0.07 Class of 2011, Chemistry/Biomolecular Science Major, Honors Program, Phillip Christiansen Graph 1: Titration Curve based off of a 4.0036 gram Maple Wood Sample Class of 2011, Chemistry/Biomolecular Science Major, Honors Program, Phillip Christiansen
