Supplementary Information (docx 31K)
advertisement

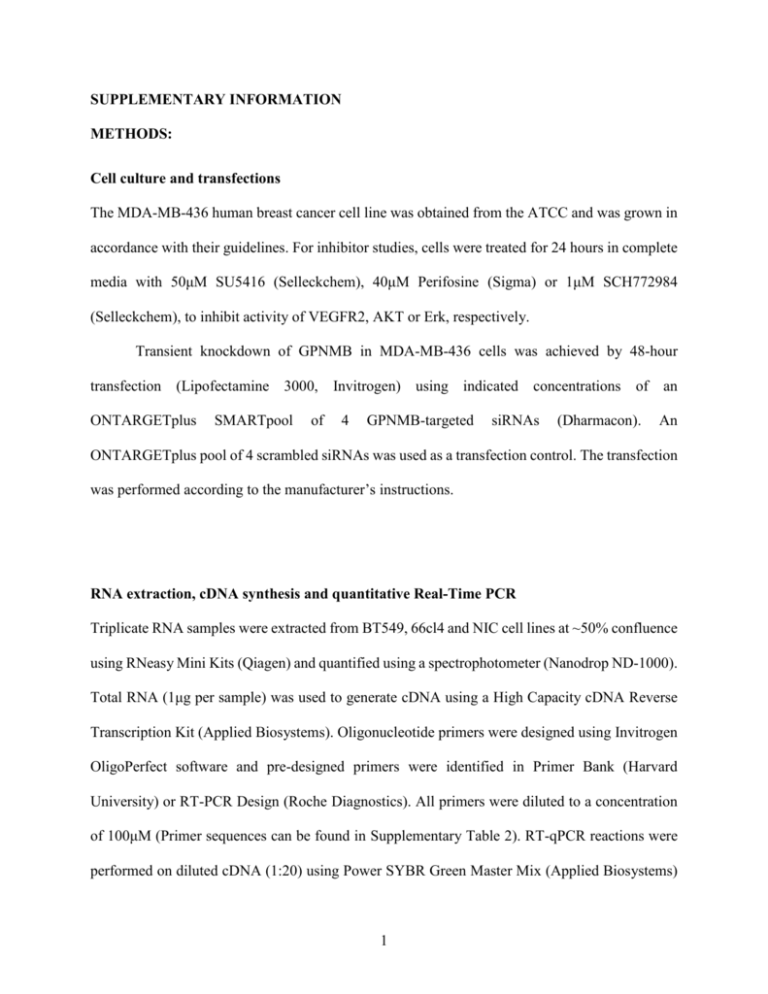
SUPPLEMENTARY INFORMATION METHODS: Cell culture and transfections The MDA-MB-436 human breast cancer cell line was obtained from the ATCC and was grown in accordance with their guidelines. For inhibitor studies, cells were treated for 24 hours in complete media with 50μM SU5416 (Selleckchem), 40μM Perifosine (Sigma) or 1μM SCH772984 (Selleckchem), to inhibit activity of VEGFR2, AKT or Erk, respectively. Transient knockdown of GPNMB in MDA-MB-436 cells was achieved by 48-hour transfection (Lipofectamine 3000, Invitrogen) using indicated concentrations of an ONTARGETplus SMARTpool of 4 GPNMB-targeted siRNAs (Dharmacon). An ONTARGETplus pool of 4 scrambled siRNAs was used as a transfection control. The transfection was performed according to the manufacturer’s instructions. RNA extraction, cDNA synthesis and quantitative Real-Time PCR Triplicate RNA samples were extracted from BT549, 66cl4 and NIC cell lines at ~50% confluence using RNeasy Mini Kits (Qiagen) and quantified using a spectrophotometer (Nanodrop ND-1000). Total RNA (1μg per sample) was used to generate cDNA using a High Capacity cDNA Reverse Transcription Kit (Applied Biosystems). Oligonucleotide primers were designed using Invitrogen OligoPerfect software and pre-designed primers were identified in Primer Bank (Harvard University) or RT-PCR Design (Roche Diagnostics). All primers were diluted to a concentration of 100μM (Primer sequences can be found in Supplementary Table 2). RT-qPCR reactions were performed on diluted cDNA (1:20) using Power SYBR Green Master Mix (Applied Biosystems) 1 and 7500 Real Time PCR System (Applied Biosystems). Reactions were performed in triplicate and GAPDH or β-actin primers were used as a control for mouse and human genes, respectively. Data is represented as the mean of the fold change of the three independent sets of cDNA calculated according to the following formula: Efficiency of target primers + 1 (average value of target primers – average of corresponding target wells) Efficiency of control primers + 1 (average value of control primers – average of corresponding control wells) Microarray analysis GPNMB-expressing clones, along with empty vector controls, were established in human BT549 and mouse 66cl4 breast cancer cell lines. Total RNA from two independent GPNMB-expressing clones, along with two empty vector clones, was isolated from both the BT549 and 66cl4 model systems. Total RNA was amplified, labeled and hybridized to whole genome 44K Agilent gene expression arrays as previously described.1 Data were normalized based on the Lowess normalization included in the Genespring software (Agilent technologies). A parametric test was used to compare the GPNMB expressing clones and the parental cell lines (p<0.05). Genes that were differentially expressed between GPNMB-expressing cells and VC cells, which exhibited a fold change greater than 2, were chosen for further analysis. Both the 66cl4 and BT549 breast cancer cell models were compared to identify genes that are commonly regulated by overexpression of mouse and human GPNMB. Immunohistochemistry analysis Tissue samples were fixed, processed and stained with Ki67, cleaved caspase-3 or CD31 antibodies as previously described.2 2 Adhesion blocking assays To determine if GPNMB-mediated adhesion to fibronectin was specifically mediated through the α5β1 receptor, 1x10⁵ BT549 cells were trypsinized and incubated on ice for 1 hour with indicated concentrations of blocking antibody targeting α5β1, α2β1 (Millipore) or control isotype antibody (BD BioSciences) diluted in 1x PBS. Subsequently, cells were seeded onto 24-well plates precoated with fibronectin (BD Biosciences) and allowed to adhere for 1 hour at 37ºC. The plates were processed and analyzed as previously described.3 3 REFERENCES: 1. Rose, A.A., et al., Osteoactivin promotes breast cancer metastasis to bone. Mol Cancer Res, 2007. 5(10): p. 1001-14. 2. Northey, J.J., et al., Distinct phosphotyrosine-dependent functions of the ShcA adaptor protein are required for transforming growth factor beta (TGFbeta)-induced breast cancer cell migration, invasion, and metastasis. J Biol Chem, 2013. 288(7): p. 5210-22. 3. Tabaries, S., et al., Claudin-2 is selectively enriched in and promotes the formation of breast cancer liver metastases through engagement of integrin complexes. Oncogene, 2011. 30(11): p. 1318-28. 4 FIGURE LEGENDS Supplementary Table 1: Identification of commonly regulated genes in response to GPNMB expression in the 66cl4 and BT549 breast cancer cell models. The list of 17 genes, with the corresponding fold change in GPNMB-expressing versus VC cells, which were similarly regulated in both the 66cl4 and BT549 cell models is shown. Neuropilin-1 was selected for further validation and analysis. Supplementary Table 2: A list of the shRNA sequences against mouse and human NRP-1 and primer sequences used for mutagenesis and RT-qPCR. Supplementary Table 3: A list of all the antibodies used in the current study. Supplementary Figure 1. Gene expression changes induced by GPNMB in murine and breast cancer cells. (a) Immunoblot analysis showing GPNMB expression in clonal (Cl) cell lines generated in independent mouse (66cl4) and human (BT549) breast cancer models. An immunoblot for α-Tubulin is included as a loading control. (b) Whole genome 44K Agilent gene expression array analysis comparing two GPNMB expressing clonal cell lines and two VC cell lines for both 66cl4 and BT549 cell models. Differentially expressed genes in GPNMB-expressing versus VC cells were filtered on a fold change of 2 or greater and a P value of < 0.05. The intersection between differentially expressed genes in the 66cl4 and BT549 cell systems revealed 17 genes that were commonly regulated by GPNMB. 5 Supplementary Figure 2. GPNMB overexpression in BT549 and 66cl4 breast cancer cells results in numerous transcriptional changes. Commonly regulated genes identified by microarray analysis were validated by RT-qPCR analysis. Transcript levels of CLU (Clusterin) (b), Serpine2 (c), ANK1 (d), AHR (e) and PNRC1 (f) were increased in GPNMB-expressing BT549 cells compared to cells containing an empty vector. Average transcript levels in GPNMB-expressing cells represent the combined result of 4 independent BT549 clones displaying elevated GPNMB expression. CLU (Clusterin) (h) and Serpine2 (i) were also found to be increased at the mRNA level in response to GPNMB overexpression in 66cl4 cells, as determined by taking the average transcript measurement of two independent GPNMB-expressing 66cl4 clones. RT-qPCR analyses displaying elevated GPNMB mRNA levels in BT549 (a) and 66cl4 (g) cells are shown. (*, p < 0.05; **, p < 0.01; ***, p < 0.001). (n = 3) Supplementary Figure 3. Neuropilin-1 expression is decreased in response to GPNMB knockdown in MDA-MB-436 breast cancer cells. GPNMB expression was transiently diminished in the MDA-MB-436 cell line using 2 different siRNA concentrations. Control cells were transfected with a pool of scrambled non-targeting siRNAs. After 48 hours, cells were lysed, processed and probed for NRP-1 and GPNMB. Α-Tubulin was used as a loading control. Supplementary Figure 4. Neuropilin-1 expression levels in NIC cells following shRNAmediated knockdown. Immunoblot analysis of NRP-1 expression in NIC VC and GPNMB-WT cells reveals a substantial knockdown of NRP-1 with the targeting shRNA. GPNMB levels remain unchanged following NRP-1 knockdown. Α-Tubulin serves as a loading control. 6 Supplementary Figure 5. Immunohistochemistry analysis of proliferation, apoptosis and angiogenesis markers in tumors derived from NIC cell lines. Primary tissue was harvested from NIC VC/NRP-1High, VC/NRP-1Low, GPNMB-WT/NRP-1High and GPNMB-WT/NRP-1Low tumors and proliferation (a), apoptosis (b) and endothelial cell recruitment (c) was assessed by immunohistochemistry. Results represent the averages of 10 images/sample taken from 5 independent primary tumor tissue samples. (*, p < 0.05; **, p < 0.01; ***, p < 0.001). Supplementary Figure 6. Immunohistochemistry for the macrophage marker F4/80. Primary mammary tumor tissue from NIC VC/NRP-1High, VC/NRP-1Low, GPNMB-WT/NRP-1High and GPNMB-WT/NRP-1Low was harvested, sectioned and stained for F4/80 to assess macrophage infiltration. Quantification of F4/80 staining is presented in Figure 2b. Images representative of the tumor margin (low magnification) and tumor core (inset) areas are shown. Scale bar represent 50μm and applies to all low magnification images. Supplementary Figure 7. NRP-1 expression following stable knockdown in BT549 human breast cancer cells. BT549 vector control (VC) and GPNMB-WT-expressing cells harboring a scrambled shRNA (shLMP) or two independent shRNAs targeting the 3’ UTR region of NRP-1 (shRNA#1 and shRNA#2) were probed for NRP-1 and GPNMB. GPNMB levels remain unchanged in BT549 cells harboring an NRP-1 knockdown. Α-Tubulin serves as a loading control. Supplementary Figure 8. GPNMB potentiates VEGF signaling specifically through the VEGFR2 axis. To inhibit VEGFR2 activity, BT549 GPNMB-WT cells were treated with 50μM Semaxanib or DMSO vehicle. After 24 hours of inhibitor or control treatment, cells were stimulated with 7 25ng/mL VEGF for the indicated times and activation of downstream signaling pathways was assessed by immunoblot analyses for pVEGFR2, VEGFR2, pERK, ERK, pAKT, AKT, NRP-1 and V5-tagged GPNMB. Α-Tubulin serves as a loading control. Band intensity was quantified and the ratios of phosphorylated to total protein were calculated and normalized to the first lane (DMSO, no VEGF). Supplementary Figure 9. GPNMB increases NRP-1 levels via AKT-mediated, but not ERKmediated, signaling. BT549 cells expressing VC or GPNMB were treated with 40μM Perifosine (a) or 1μM SCH772984 (b) for 24 hours to inhibit AKT or ERK, respectively. (a) Immunoblot analyses of NRP-1, pAKT, AKT and GPNMB (V5-tagged) in BT549 cells treated with Perifosine (AKT inhibitor). (b) Immunoblot analyses of NRP-1, pFRA-1, FRA-1 (an ERK substrate) and GPNMB (V5-tagged) in BT549 cells treated with SCH772984 (ERK inhibitor). Α-Tubulin was used as a loading control. Supplementary Figure 10. The GPNMB-mediated increase in NRP-1 expression requires its RGD domain. Immunoblot analyses showing NRP-1 and GPNMB levels in BT549 (a) and 66cl4 (b) cells expressing VC, GPNMB-WT, GPNMB-ΔCYT and GPNMB-RGDmut constructs. ΑTubulin serves as a loading control. Supplementary Figure 11. Fibronectin adhesion of GPNMB-expressing BT549 cells is specifically mediated through the α5β1 integrin receptor. BT549 VC and GPNMB-WT cells were incubated with control isotype antibodies or increasing concentrations of antibodies recognizing 8 α2β1 or α5β1 integrin receptors. Area occupied by BT549 cells was quantified by taking the pixel count from 5 independent images/well. Supplementary Figure 12. Expression levels of GPNMB mutants in NIC breast cancer cells. GPNMB levels in NIC VC, GPNMB-WT, GPNMB-ΔCYT and GPNMB-RGDmut cell lines were assayed by immunoblot. Α-Tubulin serves as a loading control. Supplementary Figure 13. Immunohistochemical analysis of NIC tumors expressing GPNMB mutant constructs. (a) Proliferation of NIC VC, GPNMB-WT, GPNMB-ΔCYT and GPNMBRGDmut tumors was assessed by Ki67 staining. (***, p < 0.001) (b) Cleaved Caspase-3 was used as a marker to determine the percentage of apoptosis in NIC tumors. (*, p < 0.05; **, p < 0.01; ***, p < 0.001) (c) Endothelial cell recruitment was determined by performing CD31 staining. (***, p < 0.001). The average quantification of 10 representative images taken from each tumor sample is shown (n = 5). Supplementary Figure 14. Immunohistochemistry for the macrophage marker F4/80. Macrophage infiltration was examined in NIC VC, GPNMB-WT, GPNMB-ΔCYT and GPNMBRGDmut expressing mammary tumors by performing immunohistochemistry for F4/80. Representative images of the tumor margin (low magnification) and tumor core (inset) areas are shown. Scale bar represent 50μm and applies to all low magnification images. 9


