Grade Conversion Tables For A
advertisement
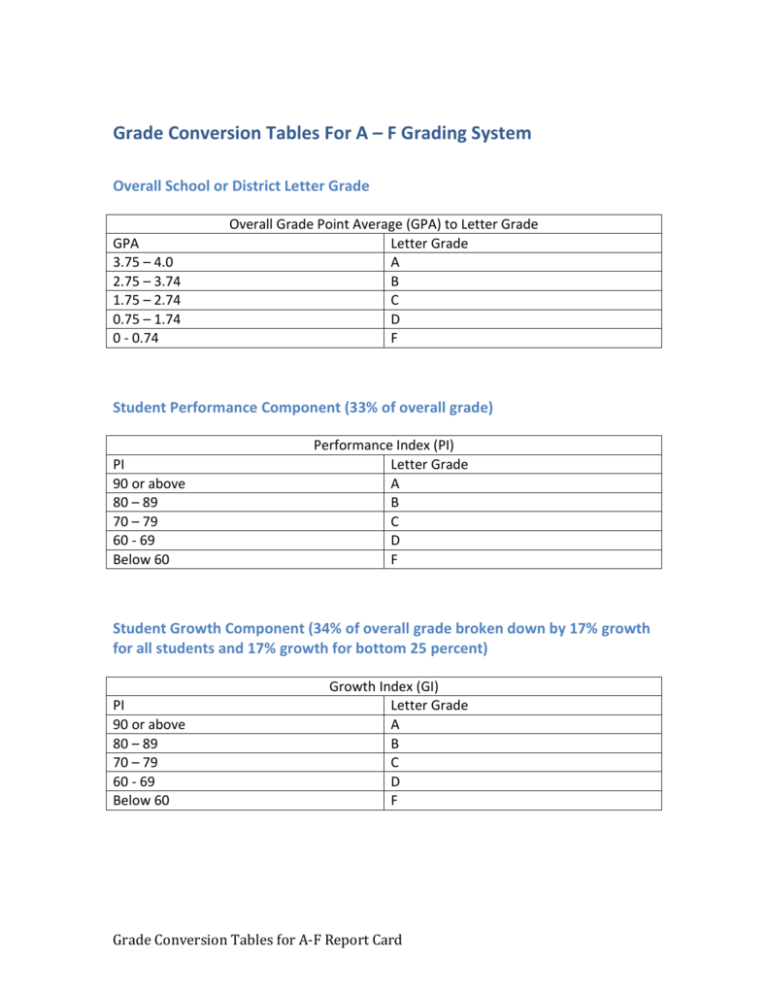
Grade Conversion Tables For A – F Grading System Overall School or District Letter Grade GPA 3.75 – 4.0 2.75 – 3.74 1.75 – 2.74 0.75 – 1.74 0 - 0.74 Overall Grade Point Average (GPA) to Letter Grade Letter Grade A B C D F Student Performance Component (33% of overall grade) PI 90 or above 80 – 89 70 – 79 60 - 69 Below 60 Performance Index (PI) Letter Grade A B C D F Student Growth Component (34% of overall grade broken down by 17% growth for all students and 17% growth for bottom 25 percent) PI 90 or above 80 – 89 70 – 79 60 - 69 Below 60 Growth Index (GI) Letter Grade A B C D F Grade Conversion Tables for A-F Report Card Whole School Improvement Component (33% of overall grade) GPA 3.75 – 4.0 2.75 – 3.74 1.75 – 2.74 0.75 – 1.74 0 - 0.74 GPA of Indicators to Letter Grade Letter Grade A B C D F Indicators of Whole School Performance by School Type Elementary Schools (Kindergarten – Grade 6) Attendance Rate 94% - 100% 92% - 93.9% 90% - 91.9% 88% - 89.9% Below 88% Attendance (.96) Letter Grade A B C D F Point Value 4 3 2 1 0 Dropout Rate 0% - .09% 1% - 1.9% 2% - 2.9% 3% - 3.9% Above 3.9% Dropout Rate (.04) Letter Grade A B C D F Point Value 4 3 2 1 0 Note: Dropout rate was not available for elementary schools in 2012. For the 2012 results, attendance was calculated as 100% of the Whole School Performance grade. Bonus Points Indicator Value School Climate Survey Y Parent and Community Engagement Y Grade Conversion Tables for A-F Report Card Points .06 .06 2 Middle Schools (Grade 7 – Grade 9) Attendance Rate 94% - 100% 92% - 93.9% 90% - 91.9% 88% - 89.9% Below 88% Attendance (.90) Letter Grade A B C D F Point Value 4 3 2 1 0 Dropout Rate 0% - .09% 1% - 1.9% 2% - 2.9% 3% - 3.9% Above 3.9% Dropout Rate (.04) Letter Grade A B C D F Point Value 4 3 2 1 0 Participation Rate 30% or Above 25% - 29% 20% - 24% 15% - 19% Below 15% Advanced Coursework (.06) Letter Grade A B C D F Indicator School Climate Survey Parent and Community Engagement Bonus Points Value Y Y Point Value 4 3 2 1 0 Points .06 .06 High School (Grade 10 – Grade 12) Graduation Rate 90% or Above 80% - 89% 70% - 79% 60% - 69% Below 60% Four Year Graduation Rate (.79) Letter Grade Point Value A 4 B 3 C 2 D 1 F 0 Grade Conversion Tables for A-F Report Card 3 Graduation Rate 90% or Above 80% - 89% 70% - 79% 60% - 69% Below 60% Five Year Graduation Rate (.03) Letter Grade Point Value A 4 B 3 C 2 D 1 F 0 Eighth Grade Low Achieving Cohort Graduation Rate (.03) Graduation Rate Letter Grade Point Value 85% or Above A 4 75% - 84% B 3 65% - 74% C 2 55% - 64% D 1 Below 55% F 0 Note: The low performing graduation rate was not available for the 2012 calculations of the A – F grading system. The 3% weight distribution was allocated to the College Entrance Exam Participation and College Entrance Exam Performance giving them a weight of 4.5%. Participation Rate 75% or Above 65% - 74% 50% - 64% 30% - 49% Below 30% Advanced Coursework Participation (.03) Letter Grade Point Value A 4 B 3 C 2 D 1 F 0 Participation Rate 90% or Above 80% - 89% 70% - 79% 60% - 69% Below 60% Advanced Coursework Performance (.03) Letter Grade Point Value A 4 B 3 C 2 D 1 F 0 Grade Conversion Tables for A-F Report Card 4 Participation Rate 75% or Above 65% - 74% 50% - 64% 30% - 49% Below 30% AP/IB Exam Performance (.03) Letter Grade A B C D F Point Value 4 3 2 1 0 Participation Rate 75% or Above 65% - 74% 50% - 64% 30% - 49% Below 30% College Entrance Exam Participation (.03) Letter Grade Point Value A 4 B 3 C 2 D 1 F 0 Participation Rate 75% or Above 65% - 74% 50% - 64% 30% - 49% Below 30% College Entrance Exam Performance (.03) Letter Grade Point Value A 4 B 3 C 2 D 1 F 0 Bonus Points Indicator Value School Climate Survey Y Parent and Community Engagement Y ACE Graduation Plan Participation Y College Remediation Rates 25% or Below Grade Conversion Tables for A-F Report Card Points .06 .06 .06 .06 5


