Charnwood – Economic Profile 2015
advertisement

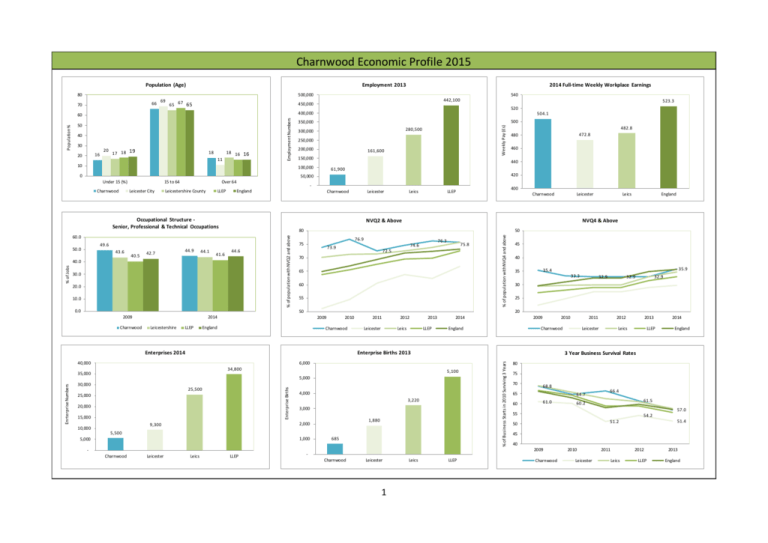
Charnwood Economic Profile 2015 Population (Age) Employment 2013 80 66 70 69 65 67 65 523.3 520 40 30 16 20 17 18 19 18 16 16 18 11 10 504.1 500 350,000 280,500 300,000 250,000 200,000 161,600 150,000 Leicester City Over 64 420 Leicestershire County LLEP - England Charnwood Occupational Structure Senior, Professional & Technical Occupations 44.9 44.1 41.6 44.6 40.0 30.0 20.0 10.0 % of population with NVQ2 and above 40.5 42.7 400 LLEP Charnwood 0.0 76.9 75 76.3 74.6 73.9 75.8 72.5 70 65 60 55 LLEP 2009 England 2010 Charnwood Enterprises 2014 2011 Leicester 2012 Leics 2013 LLEP 34,800 20,000 15,000 4,000 3,220 3,000 1,880 2,000 9,300 5,500 1,000 5,000 Leicester Leics LLEP 32.9 32.9 32.9 30 25 2009 2010 685 Leicester 1 Leics 2012 Leicester 2013 Leics LLEP 2014 England 80 75 70 68.8 65 60 64.7 61.0 LLEP 66.4 61.5 60.2 57.0 55 54.2 51.4 51.2 50 45 40 2009 - Charnwood 2011 Charnwood 3 Year Business Survival Rates 5,100 Enterprise Births 25,500 Charnwood 33.3 England 5,000 25,000 35.9 35.4 35 2014 6,000 35,000 10,000 40 Enterprise Births 2013 40,000 30,000 45 20 2014 Leicestershire England NVQ4 & Above % of Business Starts in 2010 Surviving 3 Years Charnwood Leics 50 50 2009 Leicester NVQ2 & Above 49.6 43.6 Leics 80 60.0 50.0 Leicester % of population with NVQ4 and above Charnwood 15 to 64 460 61,900 50,000 Under 15 (%) 482.8 472.8 480 440 100,000 0 Weekly Pay (£s) 50 Employment Numbers Population % 442,100 400,000 20 % of Jobs 540 450,000 60 Enrterprise Numbers 2014 Full-time Weekly Workplace Earnings 500,000 Charnwood 2010 Leicester 2011 2012 Leics LLEP 2013 England Economic Profile 2015 The information below provides understanding of different facets of the Leicester and Leicestershire economy. Data has been drawn from a number of national sources. Combined these provide a snapshot of the Leicester and Leicestershire area including Charnwood district. Business Survival Rates (3 year) 3 Year Business Survival Rates (%) 2011 2012 2009 2010 2013 Change 2009 -13 Leicester Leics LLEP 61.0 68.9 66.6 60.2 65.8 64.2 51.2 62.4 58.9 54.2 61.0 58.8 51.4 57.6 55.7 -9.6 -11.3 -10.9 Blaby Charnwood Harborough Hinckley & Bosworth Melton North West Leics Oadby & Wigston England 69.6 68.8 66.3 69.1 70.5 70.9 67.5 66.2 73.2 64.7 67.0 63.3 69.0 63.2 59.5 62.9 54.9 66.4 67.0 64.6 60.0 60.0 57.5 57.9 58.0 61.5 61.5 64.4 71.9 57.4 53.1 59.7 58.8 57.0 58.0 57.5 60.0 59.7 50.0 57.1 -10.8 -11.8 -8.3 -11.6 -10.5 -11.2 -17.5 -9.1 Source: Business Demography 2013, Tables 5.1a – 1c. The table above provides data relating to 3 year business survival rates for the years 2009 to 2013. 2013 figures are for those businesses that were started in 2010. Observations Between 2009 and 2013, 3 year business survival rates in all the areas identified in the table above fell. In all but one of the areas (Harborough) the fall was greater than average. The greatest fall was in the Oadby & Wigston district (17.5 percentage points). In 2013 the 3 year business survival rate in the LLEP area stood at 56%. This is below the England average (57.1%) At 57.6% the Leicestershire figure is in line with the England average (57.1%). At 51.4% the figure for Leicester is below average. In both Leicester and Oadby and Wigston only half of businesses started in 2010 survived after 3 years. The highest survival rate (60%) is for the Melton district. In Charnwood the 2013 business survival rate was 57%. Over the period 2009 – 2013 the business survival rate fell from 68.8% to 57%, a fall of 11.8 percentage points. Earnings 2009 2010 Full-time Workplace Earnings 2011 2012 2013 2014 Change 2009 -14 Leicester Leics 455.1 457.0 462.6 471.5 464.4 469.9 477.8 466.8 481.3 473.6 472.8 482.8 17.7 25.8 Blaby Charnwood Harborough Hinckley & Bosworth Melton North West Leics Oadby & Wigston England 476.5 499.4 448.3 456.6 385.5 435.2 393.9 495.0 498.4 480.4 481.1 474.7 407.9 466.2 422.3 504.5 498.4 479.6 455.8 470.9 431.9 479.1 390.7 504.0 463.9 479.6 459.1 494.8 421.9 481.2 405.9 512.6 445.4 492.1 485.4 498.0 429.8 480.2 416.9 520.3 484.7 504.1 498.0 514.0 403.0 480.2 414.6 523.3 8.2 4.7 49.7 57.4 17.5 45.0 20.7 28.3 2 Source: ONS Annual Survey of Hours & Earnings 2014. Note: Data is not available for the LLEP area. Observations In all the areas identified full-time workplace earnings grew over the period 2009 to 2014. In Leicester earnings grew by £17.70 and in Leicestershire £25.80. In England earnings over the same period grew by £28.30. Earnings grew in Harborough by £49.70 and in Hinckley and Bosworth by £57.40. All the areas identified in the table above have below average full-time workplace earnings. In 2014 the average wage in England was £523.30. In Leicester the figure was £472.80 and in Leicestershire £482.80. The area with the highest earnings is Hinckley & Bosworth (£514) and the area with the lowest is Melton (£403). In Charnwood full-time workplace earnings over the period 2009 to 2014 grew by £4.70 from £499/40 to £504.10. Of all the areas identified this Charnwood had the smallest growth over the period. Employment 2009 Leicester Leics LLEP Blaby Charnwood Harborough Hinckley & Bosworth Melton North West Leics Oadby & Wigston England 2010 2011 2012 2013 Change 2009 -13 Number % Share Number % Share Number % Share Number % Share Number % Share 161,900 280,200 442,100 49,700 64,200 36,900 38,800 20,200 51,000 19,400 24,068,100 36.6 63.4 100 11.2 14.5 8.3 8.8 4.6 11.5 4.4 162,500 227,000 439,500 48,300 63,500 35,800 29,100 20,700 50,500 19,200 23,982,000 37.0 51.6 100 11.0 14.4 8.1 6.6 4.7 11.5 4.4 158,300 274,400 432,600 49,100 59,800 36,800 39,700 20,300 49,600 19,000 24,062,600 36.6 63.4 100 11.3 13.8 8.5 9.2 4.7 11.5 4.4 158,100 276,000 434,100 51,800 59,900 35,400 39,700 19,200 52,200 18,000 24,208,200 36.4 63.6 100 11.9 13.8 8.2 9.1 4.4 12.0 4.1 161,600 280,500 442,100 50,800 61,900 37,500 41,200 20,000 51,100 18,000 24,552,400 36.6 63.4 100 11.5 14.0 8.5 9.3 4.5 11.6 4.1 Change % Change - 300 300 1,100 - 2,300 600 2,400 200 100 - 1,400 484,300 -0.2 0.1 0.0 2.2 -3.6 1.6 6.2 -1.0 0.2 -7.2 2.0 Source: ONS Business Registration and Employment Survey 2009 - 2013. Note: The figures in the table above have been rounded to the nearest 100. Observations The Business Registration and Employment Survey shows that employment in the LLEP area stood at 442,100 in 2013. Employment between 2009 and 2013 in the LLEP area did not grow. In Leicester employment fell by 300 and Leicestershire grew by 300. 63.4% of employment is in Leicestershire and the rest (36.6%) is in the City. In Charnwood, Melton and Oadby & Wigston employment fell. In all other districts there was growth. The largest rise was in Hinckley and Boswoth (+2,400). In 2013, 14% of all employment was in Charnwood. During the period 2009 and 2013 the number of businesses in Charnwood fell by 2,300 (64,200 to 59,900). Despite this there has been continued growth since 2011 (50,800 to 61,900). 3 Enterprises 2010 Leicester Leics LLEP Blaby Charnwood Harborough Hinckley & Bosworth Melton North West Leics Oadby & Wigston England 2011 2012 2013 2014 Change 2010 -14 Number % Share Number % Share Number % Share Number % Share Number % Share 8,100 23,700 31,900 3,300 5,100 4,300 3,900 2,100 3,500 1,500 1,797,900 25.4 74.3 100 10.3 16.0 13.5 12.2 6.6 11.0 4.7 8,000 23,600 31,600 3,300 5,000 4,300 3,800 2,200 3,500 1,500 1,780,800 25.3 74.7 100 10.4 15.8 13.6 12.0 7.0 11.1 4.7 8,400 24,400 32,800 3,600 5,200 4,400 3,900 2,200 3,600 1,600 1,842,700 25.6 74.4 100 11.0 15.9 13.4 11.9 6.7 11.0 4.9 8,600 24,500 33,100 3,400 5,300 4,500 3,900 2,300 3,600 1,600 1,862,100 26.0 74.0 100 10.3 16.0 13.6 11.8 6.9 10.9 4.8 9,300 25,500 34,800 3,700 5,500 4,700 4,000 2,300 3,800 1,700 1,950,000 26.7 73.3 100 10.6 15.8 13.5 11.5 6.6 10.9 4.9 Change % Change 1,200 1,800 2,900 400 400 400 100 200 300 200 152,100 14.8 7.6 9.1 12.1 7.8 9.3 2.6 9.5 8.6 13.3 8.5 Source: ONS UK Business Counts, 2010 – 2014. Note: The figures in the table above have been rounded to the nearest 100. Observations In 2014 there were 34,800 enterprises in the LLEP area. 73.3% (25,500) of enterprises in the LLEP area are in Leicestershire. The rest 26.7% (9,300) are in Leicester. The number of enterprises in all the areas identified has grown over the period 2010 to 2014 (2,900). In Leicester the number of enterprises grew by 14.8% (1,200) and Leicestershire the number of enterprises grew by 7.6% (1,800). In the LLEP area the number of enterprises grew by 9.1% and in England 8.5%. The districts with the largest growth were Blaby (12.1%) and Oadby & Wigston (13.3%). The district with smallest growth was Hinckley & Bosworth (2.6%). In Charnwood there was growth of 7.8%. In 2014 there were 5,500 enterprises in Charnwood. Enterprise Births 2009 Leicester Leics LLEP Blaby Charnwood Harborough Hinckley & Bosworth Melton North West Leics Oadby & Wigston England Number 1,060 2,305 3,365 2010 % Share 31.5 68.5 100 Number 1,040 2,300 3,340 2011 % Share 31.1 68.9 100 Number 1,240 2,680 3,920 2012 % Share 31.6 68.4 100 Number 1,260 2,705 3,965 2013 % Share 31.8 68.2 100 Number 1,880 3,220 5,100 Change 2009 -13 % Share 36.9 63.1 100 Change % Change 820 77.4 915 39.7 1,735 51.6 345 545 390 10.3 16.2 11.6 340 500 405 10.2 15.0 12.1 440 550 460 11.2 14.0 11.7 370 590 440 9.3 14.9 11.1 525 685 530 10.3 13.4 10.4 180 140 140 52.2 25.7 35.9 365 160 340 160 209,035 10.8 4.8 10.1 4.8 365 175 335 180 207,520 10.9 5.2 10.0 5.4 410 215 385 220 232,460 10.5 5.5 9.8 5.6 425 230 420 230 239,975 10.7 5.8 10.6 5.8 515 235 480 250 308,770 10.1 4.6 9.4 4.9 150 75 140 90 99,735 41.1 46.9 41.2 56.3 47.7 Source: ONS UK Business Counts, 2010 – 2014. Observations In the LLEP area in 2013 there were 5,100 enterprise births in the LLEP area. 63.1% (3,220) of enterprise births were in the County and 36.9% (1,880) were in the City. In all the areas identified the number of enterprise births grew between 2009 and 2013. In the City there was growth of 77.4% and in the County 39.6%. This translates to growth of 51.6% (1,735) across the LLEP Area. 4 The district with the largest growth was Oadby and Wigston (56.3%) and the lowest was Charnwood (25.7%). In Charnwood in 2013 there were 685 enterprise births. In 2009 the figure was 545. There was 47.7% growth in England. Population Charnwood Leicester City Leicestershire County LLEP England Total Population 166,100 329800 650,500 980,300 53,012,500 Under 15 (number) 26,300 65200 109,300 174,500 10,022,800 15 to 64 110,400 227,400 425,800 653,100 34,329,100 Over 64 29,400 37,200 115,400 152,700 8,660,500 Under 15 (%) 16 20 17 18 19 15 to 64 66 69 65 67 65 Over 64 18 11 18 16 16 Source: ONS Census 2011. Observations The LLEP area has a population of 980,300. Leicester has a population of 329,800 (33.6%) and Leicestershire 650,500 (66.4%). 69% of the population of Leicester are aged 15 to 64. In Leicestershire the figure is 65% (the same as England. In Leicester 11% of the population are over 65 compared with 18% in Leicestershire and 16% in England and the LLEP area. In Charnwood there is a higher than average number of people who are over 64 and a lower than average number of under-fifteens. 17% of the population of the LLEP area live in the Charnwood district. Qualifications NVQ2 & Above NVQ4 & Above 2009 2010 2011 2012 2013 2014 % Point Change Leicester Leics LLEP 51.1 70.2 63.7 54.5 71.3 65.5 60.5 71.4 67.6 63.7 72.6 69.5 62.4 73.9 69.9 66.8 75.8 72.6 15.7 5.6 8.9 22.4 29.5 27.1 24.8 29.7 28.0 27.4 29.9 29.0 27.4 29.9 29.0 28.9 32.9 31.5 29.8 34.7 33.0 Blaby Charnwood Harborough Hinckley & Bosworth Melton North West Leics Oadby & Wigston England 66.2 73.9 68.8 71.4 71.2 63.5 76.6 64.9 69.3 76.9 76.8 65.3 69.1 71.4 62.7 66.9 70.0 72.5 75.5 67.7 73.8 72.4 68.0 69.3 71.5 74.6 76.6 70.0 69.5 70.1 74.5 71.7 74.9 76.3 74.0 72.8 69.8 71.8 74.4 72.4 74.6 75.8 79.4 75.8 70.7 74.0 80.1 73.2 8.4 1.9 10.6 4.4 0.5 10.5 3.5 8.3 21.4 35.4 29.4 31.2 32.9 22.0 32.2 29.6 23.7 33.3 36.8 26.8 30.6 29.8 22.6 31 23.7 32.9 38.6 23.8 32.7 28.6 29.1 32.5 23.7 32.9 38.6 23.8 32.7 28.6 29.1 32.5 37.9 32.9 39.9 29.2 29.8 25.4 36.6 34.9 38.2 35.9 39.4 30.4 30.2 28.0 41.9 35.7 Source: ONS Annual Population. Observations NVQ2 5 - 2009 2010 2011 2012 2013 2014 % Point Change 7.4 5.2 5.9 16.8 0.5 10.0 0.8 2.7 6.0 9.7 6.1 In 2014 73% of the working age population of the LLEP area were educated to NVQ2 and above. This is in line with the England average of 73.2%. In Leicester the Figure is 66.8% and Leicestershire 75.8% All district areas have higher than average figures except Melton 70.7%. The district with the highest figure is Oadby and Wigston (80.1%). All district areas over the period 2009 to 2014 have seen increases in the numbers with NVQ2 qualifications and above, except Melton which has seen a slight drop. In Charnwood in 2014, 75.8% of the working age population had an NVQ2. In 2009 the figure was 73.9%. The figure for Charnwood has however fallen over the last year (from 76.3%). NVQ4 In 2014 33% of the working age population of the LLEP area were educated to NVQ4 and above. This is below the England average (35.7%) In Leicester the figure was 29.9% and Leicestershire 34.7%. Those districts with lower than average figures are Hinckley & Bosworth (30.4%), Melton, (30.2%) and North West Leicestershire (28%). Over the period 2009 to 2014 all district areas have seen a rise in the numbers with NVQ4 qualifications and above except Hinckley and Bosworth and Melton. The district with the highest rise was Blaby (16.8 percentage points). In Charnwood in 2014, 35.9% of the working age population had an NVQ4. In 2009 the figure was 35.4%. The 2014 figure is in line with national figures. Charnwood % Leicester % Leicestershire Leicestershire % LLEP area LLEP area % England England % Agriculture, forestry & fishing 195 3.7 15 0.2 1,700 6.9 1,715 5.2 96,000 5.2 Production 490 9.3 1,155 13.4 2,115 8.6 3,283 9.9 117,560 6.3 Construction 655 12.4 595 6.9 3,080 12.6 3,682 11.1 220,250 11.8 Motor trades 205 3.9 325 3.8 865 3.5 1,194 3.6 57,580 3.1 Wholesale 315 6.0 620 7.2 1,465 6.0 2,092 6.3 91,120 4.9 Retail 520 9.9 1,145 13.3 2,000 8.2 3,158 9.5 159,660 8.6 Transport & storage (inc. postal) 200 3.8 330 3.8 995 4.1 1,329 4.0 58,015 3.1 Accommodation & food services 300 5.7 540 6.3 1,220 5.0 1,766 5.3 106,020 5.7 Information & communication 300 5.7 450 5.2 1,265 5.2 1,720 5.2 152,700 8.2 Finance & insurance 105 2.0 505 5.9 740 3.0 1,251 3.8 40,890 2.2 Property 170 3.2 345 4.0 985 4.0 1,334 4.0 70,995 3.8 Professional, scientific & technical 810 15.4 985 11.4 3,565 14.6 4,561 13.8 325,265 17.5 Business administration and support services 330 6.3 435 5.1 1,560 6.4 2,000 6.0 126,970 6.8 Public administration and defence 25 0.5 0 0.0 110 0.4 110 0.3 4,940 0.3 Education 100 1.9 160 1.9 445 1.8 607 1.8 31,570 1.7 Health 225 330 4.3 6.3 525 475 6.1 5.5 885 1,475 3.6 6.0 1,416 1,956 4.3 5.9 76,960 125,600 4.1 6.7 Arts, entertainment, recreation and other services TOTAL 5,275 Leicester Charnwood Sector Enterprises 8,605 Source: UK Business, Size, Activity & Location 2013 Observations 6 24,470 33,075 1,862,095 The table provides a broad sector breakdown of the number of enterprises (2013). The largest sectors in the LLEP area are production (9.9%), construction (11.1%) and professional, scientific and technical (13.8%). The production sector within the LLEP area is substantially higher than the England average (9.9% versus 6.3%). Whereas the professional, scientific and technical sector is substantially lower (13.8% versus 17.5%). In Leicester the largest sectors are production (13.4%), retail (13.3%) and professional, scientific and technical (11.4%). In Leicestershire the largest sectors are construction (12.6%) and professional, scientific and technical (14.6%). In Charnwood 15.4% of sector enterprises are professional, scientific and technical and 12.4% are construction. 7 Employment - By Broad Sector Area Charnwood - Employment 2009 2013 Leicestershire - Employment 2009 2013 2009 LLEP Area - Employment 2009 2013 2013 number % number % Change number % number % 1 : Agriculture, forestry & fishing (A) 2 : Mining, quarrying & utilities (B,D and E) 3 : Manufacturing (C) 4 : Construction (F) 5 : Motor trades (Part G) 6 : Wholesale (Part G) 7 : Retail (Part G) 8 : Transport & storage (inc postal) (H) 9 : Accommodation & food services (I) 10 : Information & communication (J) 11 : Financial & insurance (K) 12 : Property (L) 13 : Professional, scientific & technical (M) 100 900 9,200 3,700 1,700 3,000 7,000 2,100 3,500 1,600 600 1,300 5,400 0.2 1.5 14.3 5.8 2.6 4.7 10.9 3.3 5.5 2.5 0.9 2.1 8.3 100 900 9,300 2,400 1,500 3,200 6,300 1,900 4,000 1,800 700 900 4,900 0.2 1.5 15.1 3.9 2.4 5.2 10.2 3.0 6.5 2.9 1.1 1.5 7.9 0 0 100 -1,300 -200 200 -700 -200 500 200 100 -400 -500 500 5,400 39,500 16,800 6,800 16,300 31,500 20,200 16,700 5,700 5,400 5,300 21,800 0.2 1.9 14.1 6.0 2.4 5.8 11.2 7.2 6.0 2.0 1.9 1.9 7.8 500 6,100 39,100 11,500 6,100 16,100 26,300 22,600 18,000 7,200 5,600 4,300 26,800 0.2 2.2 13.9 4.1 2.2 5.7 9.4 8.0 6.4 2.6 2.0 1.5 9.5 0 700 -400 -5,300 -700 -200 -5,200 2,400 1,300 1,500 200 -1,000 5,000 14 : Business administration & support services (N) 3,800 5.9 3,800 6.1 0 19,600 7.0 21,700 7.7 15 : Public administration & defence (O) 16 : Education (P) 17 : Health (Q) 18 : Arts, entertainment, recreation & other services (R,S,T and U) 2,200 9,700 5,100 3,200 3.4 15.1 7.9 5.0 1,600 9,200 5,500 3,900 2.6 14.9 8.9 6.3 -600 -500 400 700 11,000 25,400 20,000 12,600 3.9 9.1 7.1 4.5 10,100 25,100 20,400 13,300 3.6 8.9 7.3 4.7 Column Total 64,172 100 61,906 100 -2,266 280,200 100 280,500 100 2009 Change number 2013 England - Employment 2009 2013 2009 % number % Change number % number % Change 500 9,700 60,100 22,400 9,400 23,600 45,500 23,800 23,900 9,200 9,700 8,400 29,900 0.1 2.2 13.6 5.1 2.1 5.3 10.3 5.4 5.4 2.1 2.2 1.9 6.8 500 10,900 62,000 15,800 8,900 22,900 40,100 26,800 25,800 11,200 9,300 6,400 34,000 0.1 2.5 14.0 3.6 2.0 5.2 9.1 6.1 5.8 2.5 2.1 1.4 7.7 0 1,200 1,900 -6,600 -500 -700 -5,400 3,000 1,900 2,000 -400 -2,000 4,100 340,400 244,900 2,098,300 1,252,000 422,700 1,008,200 2,529,400 1,119,900 1,603,500 948,000 932,300 429,000 1,834,400 1.4 1.0 8.7 5.2 1.8 4.2 10.5 4.7 6.7 3.9 3.9 1.8 7.6 322,100 265,600 2,020,200 1,098,700 438,900 1,019,400 2,462,700 1,100,100 1,694,400 1,024,200 905,700 474,100 2,044,400 1.3 1.1 8.2 4.5 1.8 4.2 10.0 4.5 6.9 4.2 3.7 1.9 8.3 -18,300 20,700 -78,100 -153,300 16,200 11,200 -66,700 -19,800 90,900 76,200 -26,600 45,100 210,000 2,100 33,400 7.5 34,500 7.8 1,100 1,845,200 7.7 2,060,500 8.4 215,300 -900 -300 400 700 22,000 44,000 46,000 20,600 5.0 10.0 10.4 4.7 19,800 46,300 47,700 19,600 4.5 10.5 10.8 4.4 -2,200 2,300 1,700 -1,000 1,239,500 2,183,700 2,922,000 1,114,600 5.1 9.1 12.1 4.6 1,080,600 2,269,200 3,150,100 1,121,700 4.4 9.2 12.8 4.6 -158,900 85,500 228,100 7,100 300 442,100 100 442,100 100 0 24,068,100 100 24,552,352 100 484,252 Source: ONS Business Registration and Employment Survey 2009 - 2013. Observations In the LLEP area 14% of employment is in the manufacturing sector. In England the figure is 8.2%. High rates of employment are also in the health, education and retail sectors but these are more in line with national figures. The highest rate of employment in the Charnwood district is manufacturing (15.1%). In Charnwood education accounts for 14.9% of employment (England 9.2%). 8 2009 2013 2013 Occupational Structure Charnwood Variable 2009 2009% 2014 2014% Leicestershire Growth % Growth 2009 - 2014 2009 2009% 2014 2014% Leicester & Leicestershire Growth % Growth 2009 - 2014 2009 2009% 2014 2014% England Growth % Growth 2009 - 2014 2009 2009% 2014 2014% Growth % Growth 2009 - 2014 Managers, directors and senior officials Professional occupations Associate prof & tech occupations Sum Administrative and secretarial occupations Skilled trades occupations Sum Caring, leisure and other service occupations Sales and customer service occupations Sum Process, plant and machine operatives Elementary occupations 11,000 17,000 12,000 40,000 6,100 8,900 15,000 6,100 5,400 11,500 6,900 7,200 13.6 21.1 14.9 49.6 7.6 11.1 18.7 7.6 6.6 14.2 8.5 8.9 8,200 18,500 12,500 39,200 10,500 9,200 19,700 5,600 5,000 10,600 7,600 10,100 9.4 21.2 14.3 44.9 12.0 10.5 22.5 6.5 5.7 12.2 8.7 11.6 -2,800 1,500 500 -800 4,400 300 4,700 -500 -400 -900 700 2,900 -25.5 8.8 4.2 -2.0 72.1 3.4 31.3 -8.2 -7.4 -7.8 10.1 40.3 44,400 51,300 43,800 139,500 33,600 36,200 69,800 28,200 22,800 51,000 28,500 30,500 13.9 16.0 13.7 43.6 10.5 11.3 21.8 8.8 7.1 15.9 8.9 9.5 37,400 61,000 47,900 146,300 36,600 38,600 75,200 27,800 24,700 52,500 23,500 34,200 11.3 18.4 14.4 44.1 11.0 11.6 22.6 8.4 7.4 15.8 7.1 10.3 -7,000 9,700 4,100 6,800 3,000 2,400 5,400 -400 1,900 1,500 -5,000 3,700 -15.8 18.9 9.4 4.9 8.9 6.6 7.7 -1.4 8.3 2.9 -17.5 12.1 56,300 71,400 57,600 185,300 47,000 46,300 93,300 40,200 33,500 73,700 43,300 59,500 12.3 15.6 12.6 40.5 10.3 10.1 20.4 8.8 7.3 16.1 9.5 13.0 49,400 85,000 64,600 199,000 47,900 49,700 97,600 41,700 37,100 78,800 39,100 61,200 10.3 17.8 13.5 41.6 10.0 10.4 20.4 8.7 7.8 16.5 8.2 12.8 -6,900 13,600 7,000 13,700 900 3,400 4,300 1,500 3,600 5,100 -4,200 1,700 -12.3 19.0 12.2 7.4 1.9 7.3 4.6 3.7 10.7 6.9 -9.7 2.9 2,487,000 4,533,700 3,396,800 10,417,500 2,886,400 2,650,400 5,536,800 2,135,900 1,936,400 4,072,300 1,614,400 2,648,800 10.2 18.6 13.9 42.7 11.8 10.9 22.7 8.7 7.9 16.6 6.6 10.8 2,684,200 5,105,300 3,667,600 11,457,100 2,745,200 2,691,700 5,436,900 2,332,500 1,975,200 4,307,700 1,606,700 2,742,600 10.4 19.9 14.3 44.6 10.7 10.5 21.2 9.1 7.7 16.8 6.3 10.7 197,200 571,600 270,800 1,039,600 -141,200 41,300 -99,900 196,600 38,800 235,400 -7,700 93,800 7.9 12.6 8.0 10.0 -4.9 1.6 -1.8 9.2 2.0 5.8 -0.5 3.5 Sum 14,100 17.4 17,700 20.3 3,600 25.5 59,000 18.4 57,700 17.4 -1,300 -2.2 102,800 22.5 100,300 21.0 -2,500 -2.4 4,263,200 17.4 4,349,300 17 86,100 2.0 Source: ONS Annual population Survey. Note: Areas of the table above where there is no data are areas where the sample size is too small to be reliable. Observations 41.6% of occupations in the LLEP area are as managers, directors and senior officials, professional, associate professional and technical occupations in Leicestershire. In Leicestershire 44.1% of occupations are as managers, directors and senior officials, professional, associate professional and technical occupations. This is similar to England (44.6%). In Leicester the figure is 36.1% In Leicestershire all occupations saw growth in their numbers except managers, directors and senior officials, process and plant and machine operatives and caring leisure and other service occupations. In Charnwood in 2014 there were 39,200 managers, directors and senior officials, professional, associate professional and technical occupations. These make up 44.9% of occupations in the area. The figure in 2009 was 49.6%. 9


