Document
advertisement
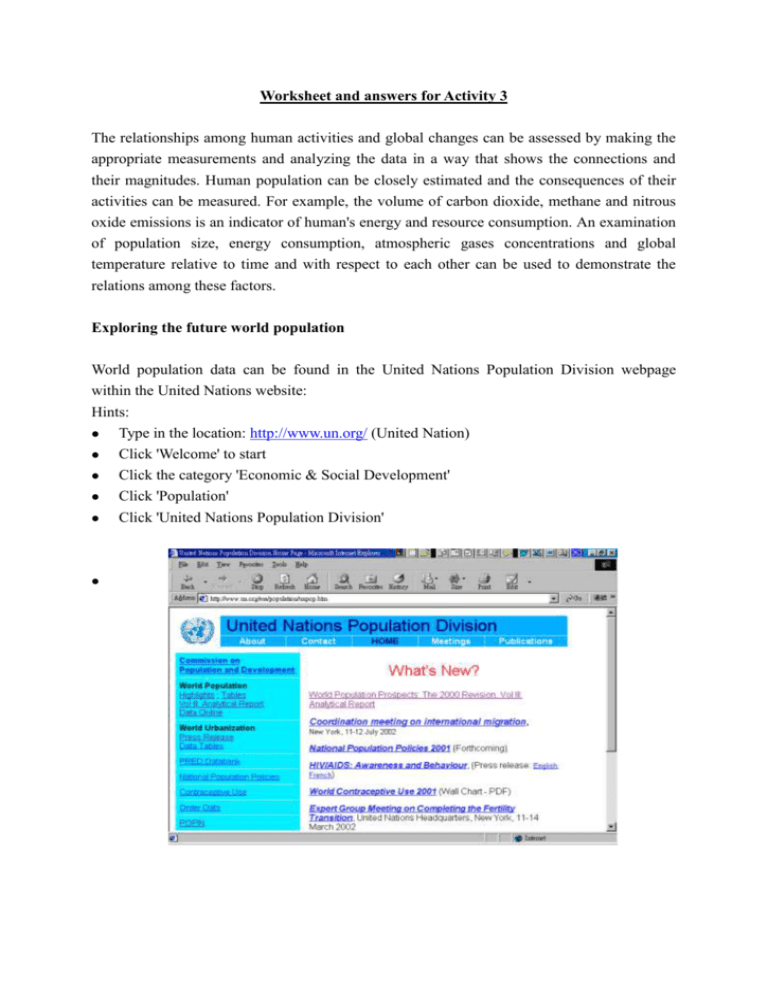
Worksheet and answers for Activity 3 The relationships among human activities and global changes can be assessed by making the appropriate measurements and analyzing the data in a way that shows the connections and their magnitudes. Human population can be closely estimated and the consequences of their activities can be measured. For example, the volume of carbon dioxide, methane and nitrous oxide emissions is an indicator of human's energy and resource consumption. An examination of population size, energy consumption, atmospheric gases concentrations and global temperature relative to time and with respect to each other can be used to demonstrate the relations among these factors. Exploring the future world population World population data can be found in the United Nations Population Division webpage within the United Nations website: Hints: Type in the location: http://www.un.org/ (United Nation) Click 'Welcome' to start Click the category 'Economic & Social Development' Click 'Population' Click 'United Nations Population Division' Click 'Highlight' under the World Population, a PDF format of "World Population Prospect The 2000 revision" document is displayed. On page 6 the 'Estimated and projected population of the world by projection variant, 1950 - 2050' is shown: Back to page 5, the 'Executive Summary' of the report is also showned: 1. State the projection of world population between 2000 and 2050 (with medium variant)? The population is projected from 6.1 billion to 9.3 billion 2. Which country contributes the greatest annual population growth rate? India Exploring the world energy consumption World energy information can be found in the World Resources Institute website: http://www.wri.org/ Hints: Type in the location directly: http://www.wri.org/sdis/ (SDIS: Sustainable Development Information Service) Click 'Global trends' Click 'Global Commons' Click the topic of 'Power Surge: Energy Use and Emissions Continue to Rise' Scroll down the screen to study the information carefully 4. Start from year 1996, how can you compare the energy demand for the past 25 years and the coming 15 years? The energy demand has risen at just over 2 percent per year for the past 25 years and will continue to climb at about this same rate over the next 15 years. 5. Which type of fuels supplies the largest world's commercial energy? Fossil fuels. 6. Which emissions account for the highest portions of the carbon dioxide released into the atmosphere each year? Energy-related emissions. Exploring the changes in mean global temperature Continued to the previous World Resources Institute webpage: Hints: Click the topic 'Climate Brief: Searching for a Greenhouse Fingerprint' 7. How much degree Celsius of temperature that our planet has been changed over the past century? Increased of 0.3oC to 0.6oC. 8. Which of the international organisation reported that the buildup of greenhouse gases from human cause influence on global climate? IPCC. Exploring the changes in atmospheric carbon dioxide Hints: Back to the http://www.wri.org/sdis/ (SDIS web page) Click on the category 'Facts and figures' 9. Apart from "Climate change", there are other categories under the "Facts and figure". Cite TWO of them. Agriculture and Biodiversity. Try to search for the following slide and answer question 10. 10. From 1750 to present, how much percentage of atmospheric carbon dioxide have been increased? An increase of over 30 percent. (Hint: 'Climate Change' 'Climate change: Facts and figures' under PowerPoint Slideshow Atmospheric carbon dioxide (CO2) concentrations (1750 to present))


