Population Indicators and Characteristics - How does
advertisement

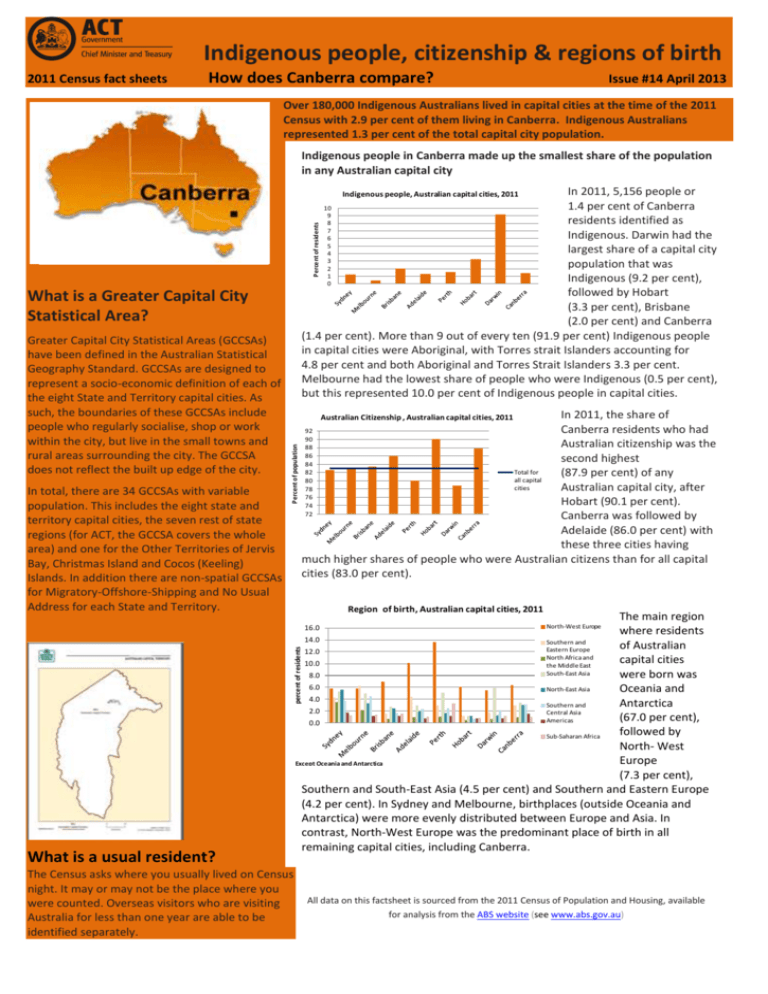
Indigenous people, citizenship & regions of birth 2011 Census fact sheets How does Canberra compare? Issue #14 April 2013 Over 180,000 Indigenous Australians lived in capital cities at the time of the 2011 Census with 2.9 per cent of them living in Canberra. Indigenous Australians represented 1.3 per cent of the total capital city population. Indigenous people in Canberra made up the smallest share of the population in any Australian capital city In 2011, 5,156 people or 1.4 per cent of Canberra residents identified as Indigenous. Darwin had the largest share of a capital city population that was Indigenous (9.2 per cent), followed by Hobart (3.3 per cent), Brisbane (2.0 per cent) and Canberra (1.4 per cent). More than 9 out of every ten (91.9 per cent) Indigenous people in capital cities were Aboriginal, with Torres strait Islanders accounting for 4.8 per cent and both Aboriginal and Torres Strait Islanders 3.3 per cent. Melbourne had the lowest share of people who were Indigenous (0.5 per cent), but this represented 10.0 per cent of Indigenous people in capital cities. Percent of residents Indigenous people, Australian capital cities, 2011 What is a Greater Capital City Statistical Area? In total, there are 34 GCCSAs with variable population. This includes the eight state and territory capital cities, the seven rest of state regions (for ACT, the GCCSA covers the whole area) and one for the Other Territories of Jervis Bay, Christmas Island and Cocos (Keeling) Islands. In addition there are non-spatial GCCSAs for Migratory-Offshore-Shipping and No Usual Address for each State and Territory. In 2011, the share of Canberra residents who had Australian citizenship was the second highest Total for (87.9 per cent) of any all capital cities Australian capital city, after Hobart (90.1 per cent). Canberra was followed by Adelaide (86.0 per cent) with these three cities having much higher shares of people who were Australian citizens than for all capital cities (83.0 per cent). Australian Citizenship , Australian capital cities, 2011 Percent of population Greater Capital City Statistical Areas (GCCSAs) have been defined in the Australian Statistical Geography Standard. GCCSAs are designed to represent a socio-economic definition of each of the eight State and Territory capital cities. As such, the boundaries of these GCCSAs include people who regularly socialise, shop or work within the city, but live in the small towns and rural areas surrounding the city. The GCCSA does not reflect the built up edge of the city. 10 9 8 7 6 5 4 3 2 1 0 92 90 88 86 84 82 80 78 76 74 72 Region of birth, Australian capital cities, 2011 The main region where residents 14.0 Southern and of Australian Eastern Europe 12.0 North Africa and capital cities 10.0 the Middle East South-East Asia were born was 8.0 6.0 North-East Asia Oceania and 4.0 Antarctica Southern and 2.0 Central Asia (67.0 per cent), Americas 0.0 followed by Sub-Saharan Africa North- West Europe Except Oceania and Antarctica (7.3 per cent), Southern and South-East Asia (4.5 per cent) and Southern and Eastern Europe (4.2 per cent). In Sydney and Melbourne, birthplaces (outside Oceania and Antarctica) were more evenly distributed between Europe and Asia. In contrast, North-West Europe was the predominant place of birth in all remaining capital cities, including Canberra. North-West Europe percent of residents 16.0 What is a usual resident? The Census asks where you usually lived on Census night. It may or may not be the place where you were counted. Overseas visitors who are visiting Australia for less than one year are able to be identified separately. All data on this factsheet is sourced from the 2011 Census of Population and Housing, available for analysis from the ABS website (see www.abs.gov.au) Dwellings, mortgages & households How does Canberra compare? 2011 Census fact sheets Issue #14 April 2013 More than two-thirds of private dwellings were separate houses in Australian capital cities The nearly 4 million (3,984,037) separate houses in Australian capital cities in 2011, constituted the main private dwelling structure (69.6 per cent), followed by flat, unit or apartments (17.9 per cent) and semidetached, row or terrace house, townhouses etc. (11.8 per cent). Distrubution of households, Australian capital cities, 2011 Percent of private dwellings 40.0 Proportion of private dwellings, Australian capital cities, 2011 90 35.0 30.0 25.0 20.0 15.0 10.0 5.0 0.0 Separate house 80 In capital cities, the main household type was couple famiies with children Sydney 70 60 50 30 20 10 Flat, unit or apartment 0 S eparate houses comprised the largest share of the dwelling stock in Hobart (81.2 per cent), followed by Brisbane (77.6 per cent) and Perth (76.7 per cent). In Sydney, less than six out of every ten (58.9 per cent) private dwellings were separate houses, which was the lowest share in any Australian capital city. Canberra (70.7 per cent) was third lowest after Darwin (60.3 per cent) and Sydney. Conversely, Sydney had the highest proportion of flats, units or apartments (27.6 per cent), followed by Darwin (21.2 per cent). Canberra had the highest share of semidetached row or terrace houses, townhouses etc. (14.9 per cent of private dwellings), followed by Sydney (12.8 per cent), Darwin and Adelaide (each 12.6 per cent). Percent of arrivals from 2007 to August 2011 Recent arrivals, Australian capital cities, 2007-2011 30 Arrived 2007 25 20 15 Arrived 2008 Arrived 2009 10 Adelaide Perth Hobart Darwin Couple fam with children One parent family Other familes Lone person Group Canberra In 2011, Sydney had the largest share of private dwellings occupied by couple families with children (36.6 per cent), followed by Melbourne (35.1 per cent) and Darwin (33.5 per cent). Canberra had nearly onethird (33.2 per cent) of private dwellings containing couple families with children. Couple families with no children was the second main household type in Canberra (26.5 per cent), ranking equal third largest of all the capital cities. After Darwin (5.6 per cent), Canberra (5.6 per cent) had the second largest share of dwellings occupied by group households. Owning a home with a mortgage common in Canberra Outright home ownership was 40 strong in 35 Owned 30 Hobart outright 25 (32.8 per cent), 20 15 Owned followed by 10 with a 5 mortgage Melbourne 0 (31.5 per cent) Rented and Adelaide (30.7 per cent). In Canberra, 27.4 per cent of occupied private dwellings were owned outright. Owning a home with a mortgage was common in Canberra, which had the second largest share of dwellings that were mortgaged (37.5 per cent) after Perth (38.0 per cent). Darwin had the largest share of dwellings being rented (36.5 per cent), followed by Brisbane (31.5 per cent), Sydney (29.7 per cent) and Canberra (29.4 per cent). Tenure types, Australian capital cities, 2011 Percent of occupied private dwellings Semi-detached, row or terrace house, townhouse etc. 40 Melbourne Brisbane Couple fam no children Arrived 2010 5 Arrived 1 Jan 2011 - 9 August 2011 Nearly one-quarter (24.8 per cent) of recent (between 2007 and August 2011) overseas arrivals to Australian capital cities, arrived in 2008. However, in Adelaide (25.1 per cent), Canberra (25.0 per cent), Darwin (24.5 per cent) and Hobart (23.9 per cent) 2009 was the year of most recent arrivals. Reference 1. Australian Bureau of Statistics, 2011. Census Dictionary Australia, Catalogue Number 2901.0 This work is copyright. Apart from any use as permitted under the Copyright Act 1968, no part may be reproduced by any process without written permission from the Territory Records Office, Community and Infrastructure Services, Territory and Municipal Services, ACT Government. GPO Box 158, Canberra City ACT 2601. Enquiries about this publication should be directed to: Chief Minister and Treasury Directorate ACT Government actdemography@act.gov.au http://www.cmd.act.gov.au/policystrategic/actstats © Australian Capital Territory, Canberra 2013


