Surrey`s Vascular Plants and Charophytes: Analysis of the Number
advertisement

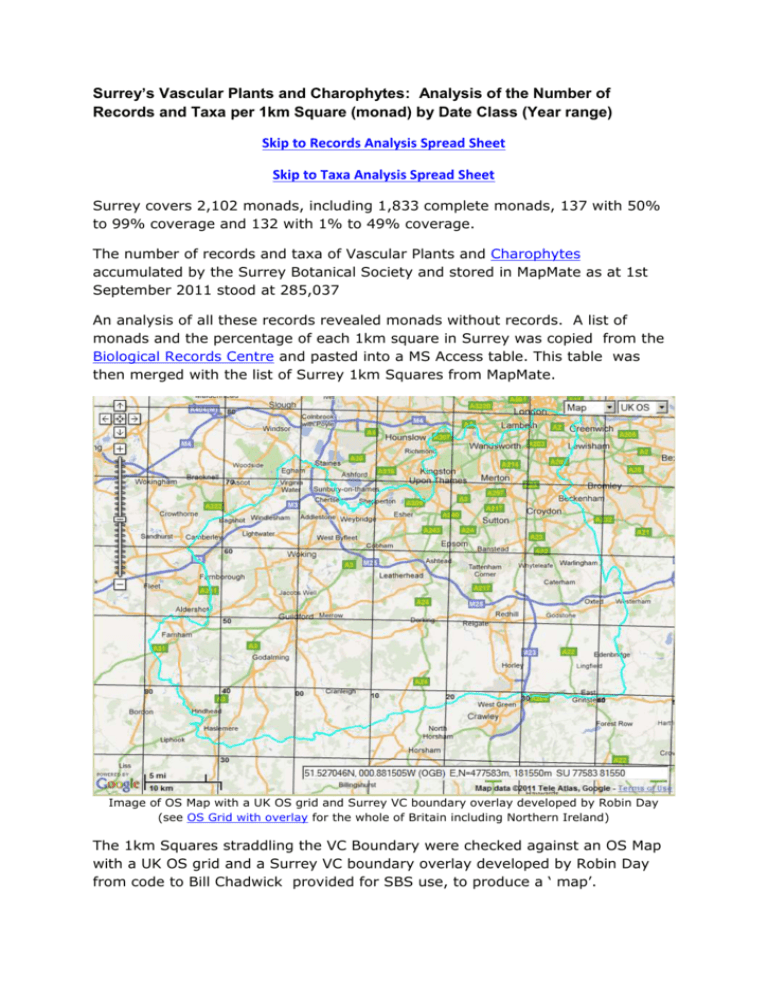
Surrey’s Vascular Plants and Charophytes: Analysis of the Number of Records and Taxa per 1km Square (monad) by Date Class (Year range) Skip to Records Analysis Spread Sheet Skip to Taxa Analysis Spread Sheet Surrey covers 2,102 monads, including 1,833 complete monads, 137 with 50% to 99% coverage and 132 with 1% to 49% coverage. The number of records and taxa of Vascular Plants and Charophytes accumulated by the Surrey Botanical Society and stored in MapMate as at 1st September 2011 stood at 285,037 An analysis of all these records revealed monads without records. A list of monads and the percentage of each 1km square in Surrey was copied from the Biological Records Centre and pasted into a MS Access table. This table was then merged with the list of Surrey 1km Squares from MapMate. Image of OS Map with a UK OS grid and Surrey VC boundary overlay developed by Robin Day (see OS Grid with overlay for the whole of Britain including Northern Ireland) The 1km Squares straddling the VC Boundary were checked against an OS Map with a UK OS grid and a Surrey VC boundary overlay developed by Robin Day from code to Bill Chadwick provided for SBS use, to produce a ‘ map’. The majority of records (c.96%) are at a sufficient precision to enable analysis at the monad (1km Square) level (see Appendix 1). Image of Excel Spread Sheet showing percentage of each 1 km Square in Surrey. The darker the green the less percentage cover. The analyses for each Date Class and all years were carried out in MS Access using queries developed for the purpose, with assistance from David Williams (see Appendix 2 for records & Appendix 3 for taxa). Date Class Year range DC 0 Pre 1929 DC 1 No. of records No. of taxa Cumulative no. of taxa 673 323 323 1930-1969 7,267 1,024 1,097 DC 2 1970-1986 13,407 1,412 1,548 DC 3 1987-1999 16,997 2,058 2,150 DC 4 2000-2009 147,375 1,984 2,421 DC 5 2010-2019 46,305 1,426 2,473 Date Classes, Year range and numbers of records and taxa. N.B. The Date Classes are historical and not intended to allow comparison between the number of records for each class. The resulting Crosstab tables were first sorted in descending order and then copied and pasted into an Excel spread sheet prior to reformatting the data to produce a ‘map’ for each Date Class and for all records see Appendix 4). Image of Excel Spread Sheet showing the number of Surrey records per 1km Square from 1666 to 2011. Acknowledgements I am extremely grateful to David Williams, Robin Day and Peter Wakeham for invaluable assistance and Bill Chadwick who provided the code for SBS use which Robin adapted Brian Pitkin, 21 September 2011 Skip to Records Analysis Spread Sheet Skip to Taxa Analysis Spread Sheet Appendix 1 Length of OSGridRef OSGridRef type Number of OSGridRefs Blank Hectads - 10km 4 Square Tetrads - 2km 5 Square 0 Subtotals & Totals 23 0.008 1959 0.687 8389 2.943 10371 Subtotal Monads - 1km Square 8 100m Square 10 10m Square 12 1m Square 6 Percentage of Squares 12.0363 82.051 2.241 0.032 34308 233877 Subtotal Totals 3.638 6388 93 274666 96.361 285037 100 Numbers of Surrey OSGridRefs per 1km Square Appendix 2 - Queries to generate a table of the number of records per 1km Square. Note: To run these queries you will first need to create a table of 1kSquareList by downloading the County list from the Biological Records Centre. Queries must be run in the order listed below. Text in bold is the name of a query and must match exactly character for character. Copy and paste the text into a separate MS Access query. Count records by 1kSquares for all years SELECT DISTINCT [1kSquareList].[1kSquare], [1kSquareList].X, [1kSquareList].Y, Count(Records.[_guk]) AS Totals, Year([Date]) AS Year FROM (Records INNER JOIN Sites ON Records.[*Site] = Sites.[_guk]) INNER JOIN 1kSquareList ON Sites.[_guk] = [1kSquareList].[_guk] GROUP BY [1kSquareList].[1kSquare], [1kSquareList].X, [1kSquareList].Y, Records.Date; Count records per 1kSquare for year range SELECT DISTINCT [Count records by 1kSquares for all years].[1kSquare], [Count records by 1kSquares for all years].X, [Count records by 1kSquares for all years].Y, Sum([Count records by 1kSquares for all years].Totals) AS Totals INTO [Count records per 1kSquare for years selected - Table] FROM [Count records by 1kSquares for all years] WHERE ((([Count records by 1kSquares for all years].Year)>=[Start year] And ([Count records by 1kSquares for all years].Year)<=[End year]) AND (([Count records by 1kSquares for all years].Y)>129 And ([Count records by 1kSquares for all years].Y)<182) AND (([Count records by 1kSquares for all years].X)>479 And ([Count records by 1kSquares for all years].X)<545)) GROUP BY [Count records by 1kSquares for all years].[1kSquare], [Count records by 1kSquares for all years].X, [Count records by 1kSquares for all years].Y; Note: The >479 and <545 (where the leading 4=SU and the leading 5=TQ in the ‘maps’) and >129 and <182 (where the leading 1 is ignored in the ‘maps’) are the absolute limits for Surrey and would need to be modified for other VC’s to ensure that no erroneous MapMate records are included Comparison of records SELECT DISTINCT [All 1kSquares including those with no records].[1kSquare], [All 1kSquares including those with no records].X, [All 1kSquares including those with no records].Y, [All 1kSquares including those with no records].[Totals] AS Totals INTO [Add these Surrey 1kSquares] FROM [Count records per 1kSquare for years selected - Table] RIGHT JOIN [All 1kSquares including those with no records] ON [Count records per 1kSquare for years selected - Table].[1kSquare] = [All 1kSquares including those with no records].[1kSquare] WHERE ((([Count records per 1kSquare for years selected - Table].[1kSquare]) Is Null) AND (([Count records per 1kSquare for years selected - Table].X) Is Null) AND (([Count records per 1kSquare for years selected - Table].Y) Is Null) AND (([Count records per 1kSquare for years selected - Table].Totals) Is Null)); Update - Add these Surrey 1kSquares UPDATE [Add these Surrey 1kSquares] SET [Add these Surrey 1kSquares].Totals = 0; Append missing 1k Squares to Record Count INSERT INTO [Count records per 1kSquare for years selected - Table] ( 1kSquare, X, Y, Totals ) SELECT [Add these Surrey 1kSquares_1].[1kSquare], [Add these Surrey 1kSquares_1].X, [Add these Surrey 1kSquares_1].Y, [Add these Surrey 1kSquares_1].Totals FROM [Add these Surrey 1kSquares] AS [Add these Surrey 1kSquares_1]; Count records per 1kSquare for years selected - Crosstab TRANSFORM Sum([Count records per 1kSquare for years selected Table].Totals) AS [The Value] SELECT [Count records per 1kSquare for years selected - Table].Y FROM [Count records per 1kSquare for years selected - Table] GROUP BY [Count records per 1kSquare for years selected - Table].Y PIVOT [Count records per 1kSquare for years selected - Table].X; SELECT DISTINCT [Count records by 1kSquares for all years].[1kSquare], [Count records by 1kSquares for all years].X, [Count records by 1kSquares for all years].Y, Sum([Count records by 1kSquares for all years].Totals) AS Totals INTO [Count records per 1kSquare for years selected - Table] FROM [Count records by 1kSquares for all years WHERE ((([Count records by 1kSquares for all years].Year)>=[Start year] And ([Count records by 1kSquares for all years].Year)<=[End year]) AND (([Count records by 1kSquares for all years].Y)>129 And ([Count records by 1kSquares for all years].Y)<182) AND (([Count records by 1kSquares for all years].X)>479 And ([Count records by 1kSquares for all years].X)<545)) Appendix 3 - Queries to generate a table of the number of records per 1km Square. Note: To run these queries you will first need to create a table of 1kSquareList by downloading the County list from the Biological Records Centre. Queries must be run in the order listed below. Text in bold is the name of a query and must match exactly character for character. Copy and paste the text into a separate MS Access query. Count taxa by 1kSquares for all years SELECT DISTINCT [1kSquareList].[1kSquare], [1kSquareList].X, [1kSquareList].Y, Taxa.Taxon, Year([Date]) AS Year FROM Taxa INNER JOIN ((Sites INNER JOIN 1kSquareList ON Sites.[_guk] = [1kSquareList].[_guk]) INNER JOIN Records ON Sites.[_guk] = Records.[*Site]) ON Taxa.[_guk] = Records.[*Taxon] GROUP BY [1kSquareList].[1kSquare], [1kSquareList].X, [1kSquareList].Y, Taxa.Taxon, Records.Date; Count taxa per 1kSquare for range selected SELECT DISTINCT [Count taxa by 1kSquares for all years].[1kSquare], [Count taxa by 1kSquares for all years].X, [Count taxa by 1kSquares for all years].Y, Count([Count taxa by 1kSquares for all years].Taxon) AS CountOfTaxon INTO [Count taxa per 1kSquare for years selected - Table] FROM [Count taxa by 1kSquares for all years] WHERE ((([Count taxa by 1kSquares for all years].Year)>=[Start year] And ([Count taxa by 1kSquares for all years].Year)<=[End year]) AND (([Count taxa by 1kSquares for all years].Y)>129 And ([Count taxa by 1kSquares for all years].Y)<182) AND (([Count taxa by 1kSquares for all years].X)>479 And ([Count taxa by 1kSquares for all years].X)<545)) GROUP BY [Count taxa by 1kSquares for all years].[1kSquare], [Count taxa by 1kSquares for all years].X, [Count taxa by 1kSquares for all years].Y; Comparison of taxa SELECT DISTINCT [All 1kSquares including those with no records].[1kSquare], [All 1kSquares including those with no records].X, [All 1kSquares including those with no records].Y, [All 1kSquares including those with no records].Totals AS Totals INTO [Add these Surrey 1kSquares] FROM [Count taxa per 1kSquare for years selected - Table] RIGHT JOIN [All 1kSquares including those with no records] ON [Count taxa per 1kSquare for years selected - Table].[1kSquare] = [All 1kSquares including those with no records].[1kSquare] WHERE ((([Count taxa per 1kSquare for years selected - Table].[1kSquare]) Is Null) AND (([Count taxa per 1kSquare for years selected - Table].X) Is Null) AND (([Count taxa per 1kSquare for years selected - Table].Y) Is Null) AND (([Count taxa per 1kSquare for years selected - Table].CountOfTaxon) Is Null)); Update - Add these Surrey 1kSquares UPDATE [Add these Surrey 1kSquares] SET [Add these Surrey 1kSquares].Totals = 0; Append missing 1k Squares to Taxa Count INSERT INTO [Count taxa per 1kSquare for years selected - Table] ( 1kSquare, X, Y, CountOfTaxon ) SELECT [Add these Surrey 1kSquares].[1kSquare], [Add these Surrey 1kSquares].X, [Add these Surrey 1kSquares].Y, [Add these Surrey 1kSquares].Totals FROM [Add these Surrey 1kSquares] GROUP BY [Add these Surrey 1kSquares].[1kSquare], [Add these Surrey 1kSquares].X, [Add these Surrey 1kSquares].Y, [Add these Surrey 1kSquares].Totals; Count taxa per 1kSquare for years selected – Crosstab TRANSFORM Sum([Count taxa per 1kSquare for years selected Table].CountOfTaxon) AS [The Value] SELECT [Count taxa per 1kSquare for years selected - Table].Y FROM [Count taxa per 1kSquare for years selected - Table] GROUP BY [Count taxa per 1kSquare for years selected - Table].Y PIVOT [Count taxa per 1kSquare for years selected - Table].X;


![Presentation [] - VideoGameAudio.com](http://s2.studylib.net/store/data/005720670_1-cf726d95b294f1b37f6f005235b97679-300x300.png)


