Sample Calculations for Nonpoint Source Projects
advertisement
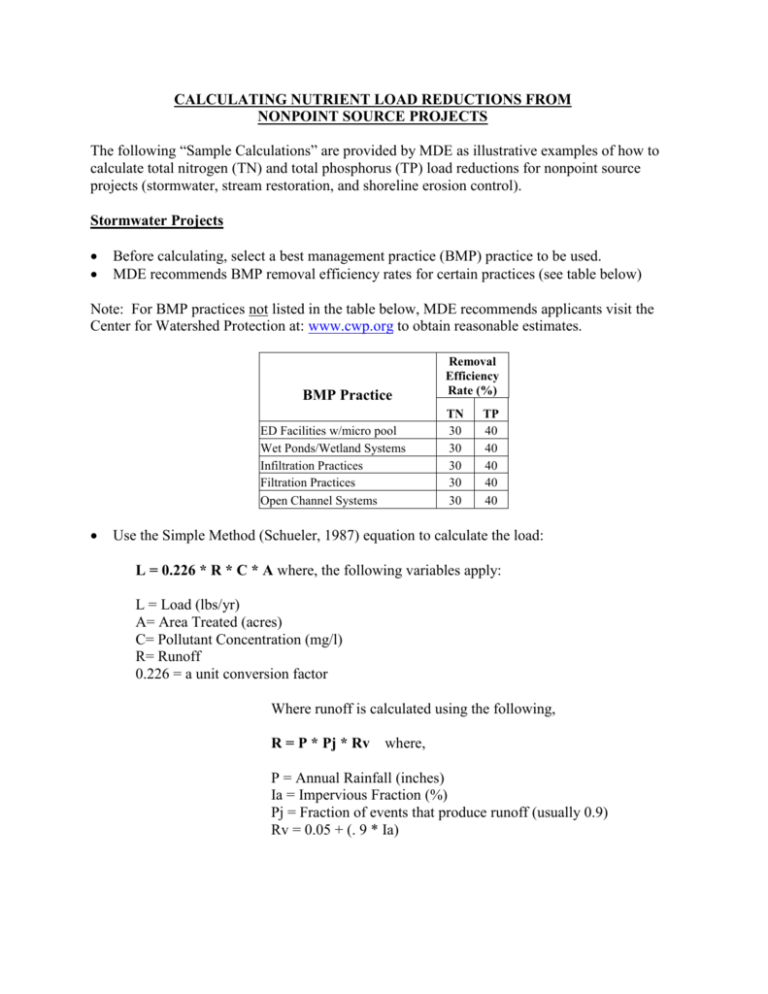
CALCULATING NUTRIENT LOAD REDUCTIONS FROM NONPOINT SOURCE PROJECTS The following “Sample Calculations” are provided by MDE as illustrative examples of how to calculate total nitrogen (TN) and total phosphorus (TP) load reductions for nonpoint source projects (stormwater, stream restoration, and shoreline erosion control). Stormwater Projects Before calculating, select a best management practice (BMP) practice to be used. MDE recommends BMP removal efficiency rates for certain practices (see table below) Note: For BMP practices not listed in the table below, MDE recommends applicants visit the Center for Watershed Protection at: www.cwp.org to obtain reasonable estimates. BMP Practice ED Facilities w/micro pool Wet Ponds/Wetland Systems Infiltration Practices Filtration Practices Open Channel Systems Removal Efficiency Rate (%) TN 30 30 30 30 30 TP 40 40 40 40 40 Use the Simple Method (Schueler, 1987) equation to calculate the load: L = 0.226 * R * C * A where, the following variables apply: L = Load (lbs/yr) A= Area Treated (acres) C= Pollutant Concentration (mg/l) R= Runoff 0.226 = a unit conversion factor Where runoff is calculated using the following, R = P * Pj * Rv where, P = Annual Rainfall (inches) Ia = Impervious Fraction (%) Pj = Fraction of events that produce runoff (usually 0.9) Rv = 0.05 + (. 9 * Ia) Sample Calculation # 1 - NEW SWM PRACTICES Event Mean Concentration Method (A) (B) (C) (D) (E) (F) TN Load TP Load After After TN TP Reduction Reduction Difference Difference (lbs/yr) (lbs/yr) (lbs/yr) (lbs/yr) 1,084 139 464 93 1,084 139 464 93 1,084 139 464 93 1,084 139 464 93 1,084 139 464 93 TN TP Treated Concentration Concentration TN Load TP Load Area (acres) (mg/l) (mg/l) (lbs/yr) (lbs/yr) 300 2 0.30 1,548 232 300 2 0.30 1,548 232 300 2 0.30 1,548 232 300 2 0.30 1,548 232 300 2 0.30 1,548 232 Rainfall Average in Maryland = 40 inches Imperviousness = 28% equivalent to Medium Density Residential (based on work by Cappiella, K. and K. Brown, “Impervious Cover and Land Use in the Chesapeake Bay Watershed,” Center for Watershed Protection. Ellicott City, Md, 2001) Average Urban Pollution Concentrations for TN and TP were cited from the Maryland Stormwater Design Manual, see pp 1.6. Columns E and F represent the reduced load associated with each one of the BMP practices shown in Table 1 above when the recommended efficiency removal rates are used. BMP Practice ED Facilities w/micro pool Wet Ponds/Wetland Systems Infiltration Practices Filtration Practices Open Channel Systems Expected Pollutant Removal TN (lbs/yr) TP (lbs/yr) 442 88 442 88 442 88 442 88 442 88 Sample Calculation # 2 - SWM RETROFIT If the volume of water or land area to be treated is less than 100% (in this presented case only 75% of water volume is treated), the following calculation can be made to quantify the anticipated load removal: Event Mean Concentration Method (A) (B) (C) (D) (E) (F) TN Load TP Load After After TN TP Reduction Reduction Difference Difference (lbs/yr) (lbs/yr) (lbs/yr) (lbs/yr) 1,200 163 348 70 1,200 163 348 70 1,200 163 348 70 1,200 163 348 70 1,200 163 348 70 TN TP Treated Concentration Concentration TN Load TP Load Area (acres) (mg/l) (mg/l) (lbs/yr) (lbs/yr) 300 2 0.30 1,548 232 300 2 0.30 1,548 232 300 2 0.30 1,548 232 300 2 0.30 1,548 232 300 2 0.30 1,548 232 Rainfall Average in Maryland = 40 inches Imperviousness = 28% equivalent to Medium Density Residential (based on work by Cappiella, K. and K. Brown, “Impervious Cover and Land Use in the Chesapeake Bay Watershed,” Center for Watershed Protection. Ellicott City, Md, 2001) Average Urban Pollution Concentrations for TN and TP were cited from the Maryland Stormwater Design Manual, see pp 1.6. Columns E and F represent the reduced load associated with each one of the BMP practices shown in Table 1 above when the recommended efficiency removal rates are used. BMP Practice ED Facilities w/micro pool Wet Ponds/Wetland Systems Infiltration Practices Filtration Practices Open Channel Systems Expected Pollutant Removal TN (lbs/yr) TP (lbs/yr) 348 70 348 70 348 70 348 70 348 70 Sample Calculation # 3 – STREAM RESTORATION For stream restoration projects, the following reduction efficiency rates are advised: TN Reduction Efficiency Rate (lbs/linear foot) 0.202 TP Reduction Efficiency Rate (lbs/linear foot) 0.0107 Example: A stream restoration project for Little Red Creek is proposed to restore a 2,000 linear foot stream reach (as measured down center of stream). The result is found by multiplying 2,000 times each of the recommended efficiency reduction rates above; therefore, the reduced load associated with the restoration would be: BMP Practice Stream Restoration Expected Pollutant Removal TN (lbs/yr) TP (lbs/yr) 400 21.4 Sample Calculation # 4 – SHORELINE EROSION CONTROL For shoreline restoration projects to address erosion problems, the following calculation is advised: TN Reduction Efficiency Rate (lbs/year per ton of soil*) 0.73 TP Reduction Efficiency Rate (lbs/ year per ton of soil*) 0.48 * Ton of soil prevented from eroding = [Length of Shoreline (ft) * Bank Height (ft) * Historic Rate of Erosion (ft/yr) * 120]/2000 Example: A living shoreline project for Big Blue River is proposed to control erosion from a 1,000’ long by 5’ high area experiencing an historic erosion rate of 0.2 feet per year. The result is found by multiplying the ton of soil prevented from eroding times each of the recommended efficiency reduction rates above; therefore, the reduced load associated with the restoration would be: BMP Practice Shoreline Erosion Control Expected Pollutant Removal TN (lbs/yr per ton of soil) TP (lbs/year per ton of soil) 43.8 28.8 Sample Calculation FAQs Q1: Are the Removal Efficiency Rates in the Design Manual consistent with those developed by the Chesapeake Bay Program (CBP)? A1: There may be different values recommended by CBP than those recommended by the Department. The Department suggests using removal rates based upon those found in the Maryland Stormwater Design Manual. CBP is currently reevaluating efficiency rates for specific BMPs. Information can be found at http://www.chesapeakebay.net/tribtools.htm Q2: Can I use alternative efficiency removal rates in my calculations? A2: Yes, but you must document the sources of the removal rates and describe why you have used them. The Department acknowledges that removal rates vary considerably based on many factors, such as implementation and site characteristics. There are other valid methods to calculate loading rate reductions for these parameters and applicants proposing projects may provide alternative calculation methods and variables that are generally accepted and reasonable. Q3: The Design Manual addresses new development, but my project is a retrofit. Are these standards still applicable? A3: Yes. The Design Manual is directed toward new development and in most cases retrofits will not be able to perform at 100% of the removal rate recommended. Therefore, applicants should adjust the removal efficiency to a rate which is proportional to the water volume or land area that the BMP practice will be able to treat. Refer to Sample Calculation #2 for an example, which uses a reduced efficiency of 75%, i.e., a twenty five percent reduction from the BMP efficiency rates. Q4: What are other typical pollution concentrations from the Design Manual? A4: The Design Manual contains a table of Typical Pollutant Concentrations Found in Urban Stormwater available on the web at: http://www.mde.state.md.us/programs/Water/StormwaterManagementProgram/Pages/Programs/WaterPrograms/sedimentandst ormwater/default.aspx
