Suicide Homework
advertisement

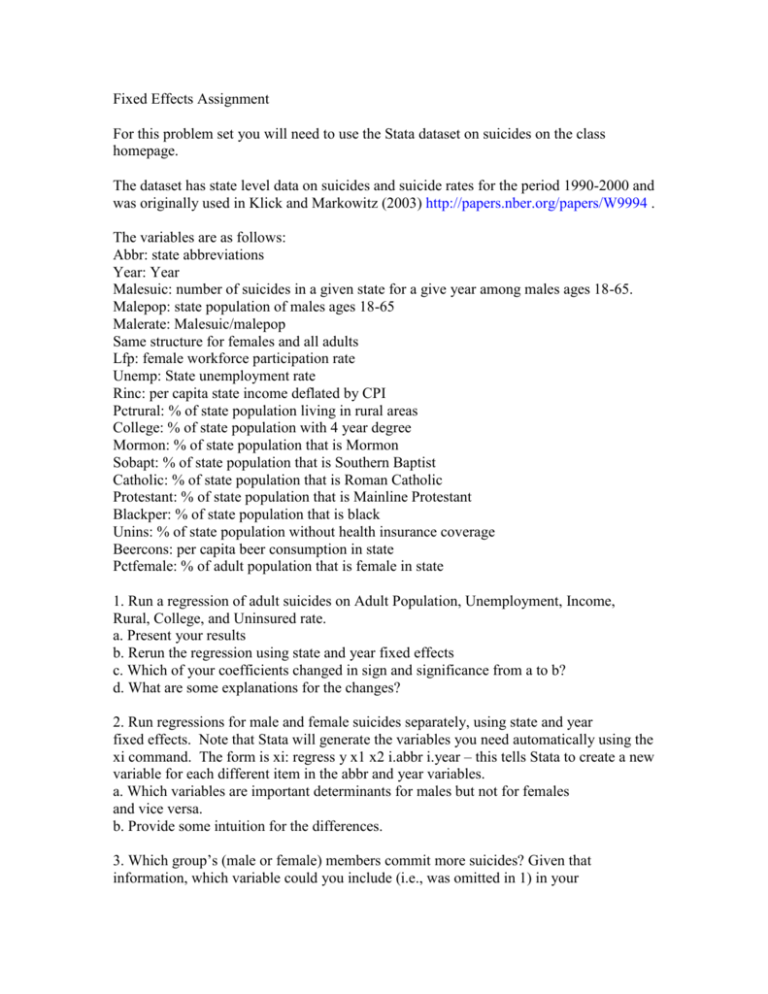
Fixed Effects Assignment For this problem set you will need to use the Stata dataset on suicides on the class homepage. The dataset has state level data on suicides and suicide rates for the period 1990-2000 and was originally used in Klick and Markowitz (2003) http://papers.nber.org/papers/W9994 . The variables are as follows: Abbr: state abbreviations Year: Year Malesuic: number of suicides in a given state for a give year among males ages 18-65. Malepop: state population of males ages 18-65 Malerate: Malesuic/malepop Same structure for females and all adults Lfp: female workforce participation rate Unemp: State unemployment rate Rinc: per capita state income deflated by CPI Pctrural: % of state population living in rural areas College: % of state population with 4 year degree Mormon: % of state population that is Mormon Sobapt: % of state population that is Southern Baptist Catholic: % of state population that is Roman Catholic Protestant: % of state population that is Mainline Protestant Blackper: % of state population that is black Unins: % of state population without health insurance coverage Beercons: per capita beer consumption in state Pctfemale: % of adult population that is female in state 1. Run a regression of adult suicides on Adult Population, Unemployment, Income, Rural, College, and Uninsured rate. a. Present your results b. Rerun the regression using state and year fixed effects c. Which of your coefficients changed in sign and significance from a to b? d. What are some explanations for the changes? 2. Run regressions for male and female suicides separately, using state and year fixed effects. Note that Stata will generate the variables you need automatically using the xi command. The form is xi: regress y x1 x2 i.abbr i.year – this tells Stata to create a new variable for each different item in the abbr and year variables. a. Which variables are important determinants for males but not for females and vice versa. b. Provide some intuition for the differences. 3. Which group’s (male or female) members commit more suicides? Given that information, which variable could you include (i.e., was omitted in 1) in your adult suicide regression to improve the fit of the regression? What is your expected sign on that variable’s coefficient? Re-run the regression from 1 (with state and year fixed effects) and see if any of the coefficients change sign or significance. 4. Rerun your regression from 3 with the religion variables. Which religion variables are significant determinants of adult suicides? Are the religion variables jointly significant? 5. Rerun your regression from 4 adding the beer consumption variable. Can we interpret the estimate effect of beer consumption on suicide as a causal effect? Why or why not? Do we have more confidence in the causal interpretation of the beer coefficient in this regression than we would if we ran a simple cross sectional regression that used data for each state for a single year only? Why or why not?


