2010CAPACITYANALYSIS - Bear Valley Water District
advertisement
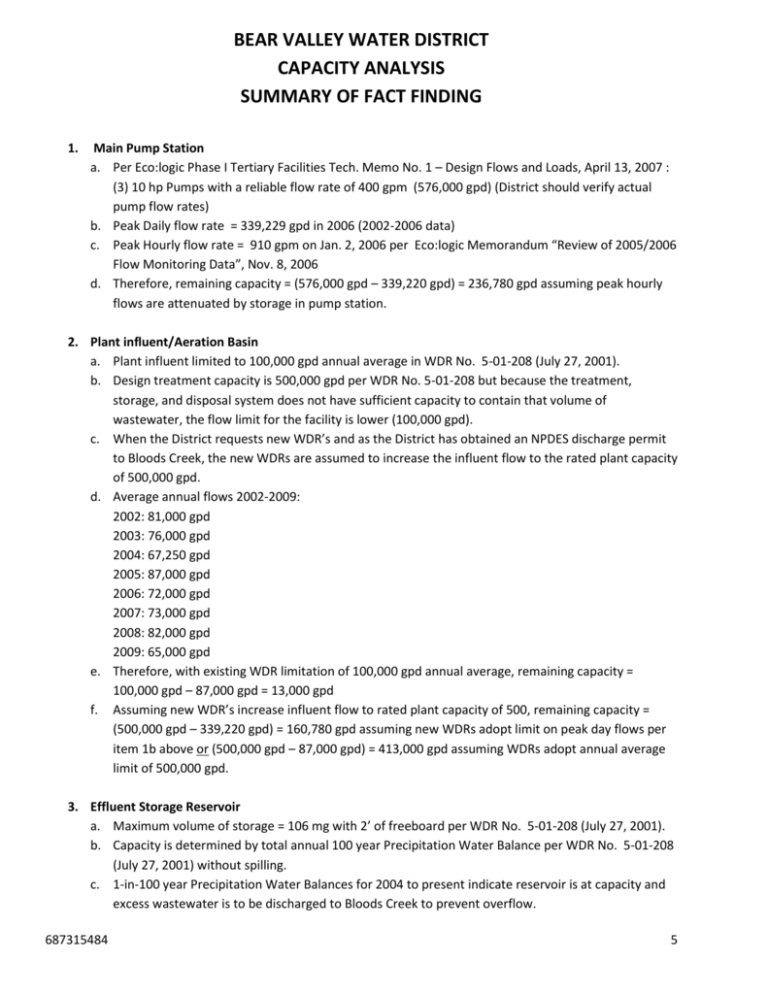
BEAR VALLEY WATER DISTRICT CAPACITY ANALYSIS SUMMARY OF FACT FINDING 1. Main Pump Station a. Per Eco:logic Phase I Tertiary Facilities Tech. Memo No. 1 – Design Flows and Loads, April 13, 2007 : (3) 10 hp Pumps with a reliable flow rate of 400 gpm (576,000 gpd) (District should verify actual pump flow rates) b. Peak Daily flow rate = 339,229 gpd in 2006 (2002-2006 data) c. Peak Hourly flow rate = 910 gpm on Jan. 2, 2006 per Eco:logic Memorandum “Review of 2005/2006 Flow Monitoring Data”, Nov. 8, 2006 d. Therefore, remaining capacity = (576,000 gpd – 339,220 gpd) = 236,780 gpd assuming peak hourly flows are attenuated by storage in pump station. 2. Plant influent/Aeration Basin a. Plant influent limited to 100,000 gpd annual average in WDR No. 5-01-208 (July 27, 2001). b. Design treatment capacity is 500,000 gpd per WDR No. 5-01-208 but because the treatment, storage, and disposal system does not have sufficient capacity to contain that volume of wastewater, the flow limit for the facility is lower (100,000 gpd). c. When the District requests new WDR’s and as the District has obtained an NPDES discharge permit to Bloods Creek, the new WDRs are assumed to increase the influent flow to the rated plant capacity of 500,000 gpd. d. Average annual flows 2002-2009: 2002: 81,000 gpd 2003: 76,000 gpd 2004: 67,250 gpd 2005: 87,000 gpd 2006: 72,000 gpd 2007: 73,000 gpd 2008: 82,000 gpd 2009: 65,000 gpd e. Therefore, with existing WDR limitation of 100,000 gpd annual average, remaining capacity = 100,000 gpd – 87,000 gpd = 13,000 gpd f. Assuming new WDR’s increase influent flow to rated plant capacity of 500, remaining capacity = (500,000 gpd – 339,220 gpd) = 160,780 gpd assuming new WDRs adopt limit on peak day flows per item 1b above or (500,000 gpd – 87,000 gpd) = 413,000 gpd assuming WDRs adopt annual average limit of 500,000 gpd. 3. Effluent Storage Reservoir a. Maximum volume of storage = 106 mg with 2’ of freeboard per WDR No. 5-01-208 (July 27, 2001). b. Capacity is determined by total annual 100 year Precipitation Water Balance per WDR No. 5-01-208 (July 27, 2001) without spilling. c. 1-in-100 year Precipitation Water Balances for 2004 to present indicate reservoir is at capacity and excess wastewater is to be discharged to Bloods Creek to prevent overflow. 687315484 5 4. Spray fields a. Disposal Capacity to be based upon total annual 100 year precipitation conditions. b. Design effluent disposal capacity is approx. 72 MG/year based on the existing District disposal land that consists of approx. 80 acres that are suitable for irrigation disposal….Without the temporary USFS Special Permit Land (40 acres) the disposal area is reduced to 62 acres and disposal capacity is reduced to 54 MG/year. (Eco:Logic letter to Anand Mamidi, RWQCB re: BVWD Tentative NPDES Permit, May 9, 2005) c. Actual disposal volumes: 2005: 66 mg (1:10 precipitation year, used all of available 80 acres) 2006: 84 mg (1:100 precipitation year, used all of available 80 acres) 2007: 50 mg (did not use all of available 80 acres) 2008: 56 mg (did not use all of available 80 acres) 2009: 48 mg (did not use all of available 80 acres) 2009 1-in-100 water balance: 58.2 mg (projected) d. Based upon historical disposal volumes: Capacity of spray fields = 84 mg/year (230,137 gpd) Capacity of spray fields/acre/year = (84mg/80 acre) = 1.05mg/acre/year e. Based upon 1-in-100 year precipitation projection: Capacity of spray fields = 58.2 mg/year (159,452 gpd) Capacity of spray fields/acre/year = (58.2mg/80 acre) = 0.73mg/acre/year 5. Bloods Creek a. 2003 monitoring of Bloods Creek indicates up to 63 mg/yr could be feasibly discharged while maintaining 20:1 dilution. Discharge is recommended to be limited to 1 day in 4 which reduces the potential discharge capacity to 16 mg/year. (BVWD agenda item, Eco:logic, Re: Presentation of Draft NPDES Permit Application and Technical Support Document, Feb. 13, 2004.) b. NPDES Permit No. CA0085146 adopted Oct. 2005 does not contain limitations on days of disposal (1 day in 4). Permit requires 20:1 dilution, Monthly Average Discharge limit of 1 mgd and Daily Maximum Discharge limit of 2.5 mgd. c. “Based on 2003 Bloods Creek flow monitoring data, District had potential to discharge approximately an additional maximum volume of 63 mg of effluent while maintaining a 20 to 1 dilution of effluent and maximum effluent discharge rate of 2.5 mgd” “Assuming the 40% of the water that can be discharged to Bloods Creek is of wastewater origins, than approximately an additional 25 million gallons per year could have been accommodated in 2003.” “Using the District’s Standard Design Specifications, 25 million gallons per year would correspond to approximately 230 equivalent residential units (for 300 gallons per unit per day average wastewater flow).” (BVWD agenda item, Eco:logic, Re: Capacity for New Development – Meeting with Alpine County Planning Department, March 17, 2006) d. History of water balance 1-in-100 year predicted discharges to Bloods Creek : i. BVWD agenda item, Eco:logic, Re: Presentation of Draft NPDES Permit Application and Technical Support Document, Feb. 13, 2004: 2004 1-in-100 year (with 160 ac disposal land): 11.6 mg 2011 1-in-100 year projection (with 120 ac. disposal land, 165 additional ESFU at 180gpd/ESFU, 47% occupancy: 33.7 mg 687315484 6 ii. Eco:Logic letter to Anand Mamidi, RWQCB re: BVWD Tentative NPDES Permit, May 9, 2005: 2006 1-in-100 year projection (with 160 ac disposal land and 83 esfu at 190 gpd,): 15.3 mg 2009 1-in-100 year projection (with 160 ac disposal land and 91 esfu at 190 gpd): 16.0 mg iii. 2005 Land Disposal Maximization Report, Eco:Logic, Nov. 2005: 2006 1-in-100 year projection (with 80 ac disposal land): 44.4 mg iv. 2006 Land Disposal Maximization Report, Eco:Logic, Oct. 2006: 2007 1-in-100 year projection (with 80 ac disposal land): 30.7 mg v. 2007 Land Disposal Maximization Report, Eco:Logic, Nov. 2007: 2008 1-in-100 year projection (with 80 ac disposal land): 48.7 mg vi. 2008 Land Disposal Maximization Report, Eco:Logic, Nov. 2008: 2009 1-in-100 year projection (with 80 ac disposal land): 61.7 mg vii. Revised 2009 1-in-100 projection, Weber, Ghio and Assoc., Jan. 2010: (See Attached) 2009 -in-100 year projection (with 80 ac disposal land): 60.0 mg e. “Since during 2005, the maximum ending month storage volume was about 93 million gallons and the peak daily effluent storage volume was recorded at 99.4 million gallons, the maximum calculated water balance storage requirements have been increased by a similar 107% to be consistent with observations during 2005.” (2005 Land Disposal Maximization Report (LDMR), Eco:Logic, Nov. 2005). The 7% increase in projected required storage reservoir volume was also used in 2006. The 2008 water balance overestimated required storage reservoir volume by 2%. f. Based upon estimated Bloods Creek discharge capacity and revised 2009 1-in-100 year water balance discharge projection (without any adjustment per 5.e. above): remaining capacity of Bloods Creek is 63mg/year – 60mg/year = 3.0 mg/year. 6. Flows per ESFU and occupancy rates a. “2002 Land Disposal Maximization Plan, prepared in February of 2002, assuming that occupied residences will produce 180 gallons of sewage per day on average, and that future occupancy will be 32%.....District influent monitoring supports 180 gallons per day per ESFU for planning and design of treatment, storage and disposal systems as appropriate on an annual average basis with peak flows accounted for on a seasonal basis” (BVWD agenda item, Eco:logic, Re: Presentation of Draft NPDES Permit Application and Technical Support Document, Feb. 13, 2004) b. “given the recent census and flow data, average per occupied residential unit wastewater production of 190 gallons per unit per day will be used for projection of wastewater demands” (Technical Support Document to Form 200: Report of Waste Discharge for BVWD, Eco:logic, April, 2004) f. “Considering these factors, we project that new connections would be primary residences producing 190 gallons per day of wastewater and that current (1997 basis) area occupancy, skier visit and summer usage would continue.” (Eco:Logic letter to Anand Mamidi, RWQCB re: BVWD Tentative NPDES Permit, May 9, 2005) g. “Future Flows Wastewater flows from future connections to the Bear Valley Water District were estimated based on the estimated average daily wastewater flow per equivalent residence of 190 gallons per unit per day. Current occupancy within the District is approximately 32%”.” (Eco:Logic letter to Anand Mamidi, RWQCB re: BVWD Tentative NPDES Permit, May 9, 2005) h. “from District Records, approximately 550 equivalent residential units currently exist within the Bear Valley Village area…however , approximately 34% of the 550 units are expected to be occupied (32% full time occupancy and 2% vacation rental occupancy)….Analysis of 2005 Bear Valley flow data support using 180 gallons per EDU per day on average for occupied residences in Bear Valley for the 687315484 7 purpose of planning future wastewater facilities” (BVWD Phase I Facilities Plan, Eco:Logic, Nov. 2006) 687315484 8
