Experiment calculations - Lesson element - Learner task
advertisement
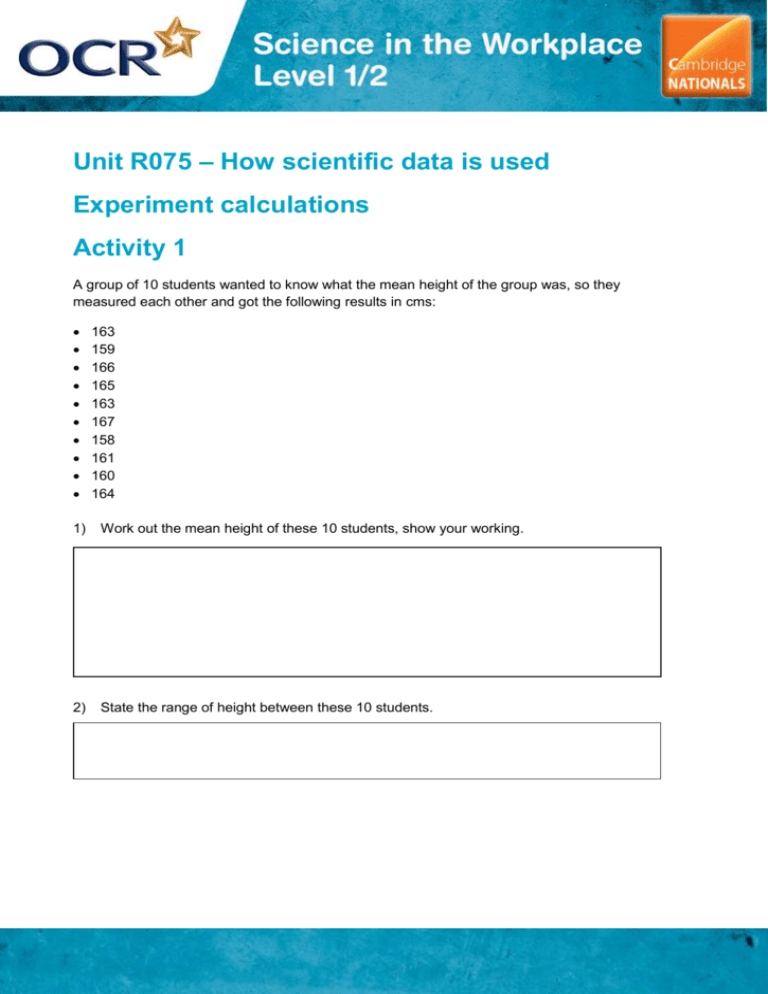
Unit R075 – How scientific data is used Experiment calculations Activity 1 A group of 10 students wanted to know what the mean height of the group was, so they measured each other and got the following results in cms: 163 159 166 165 163 167 158 161 160 164 1) Work out the mean height of these 10 students, show your working. 2) State the range of height between these 10 students. Activity 2 Some students wanted to find out the pH of rain water in their town. They went out and placed 10 collection containers in gardens along one street. When it had rained they collected their samples and brought them back to the laboratory where they used universal indicator to test the pH. They obtained the following results: 5.5 5.6 5.5 5.4 5.5 5.7 5.4 6.2 5.5 5.6 1) What is the range for this data? 2) Do you think this is reliable data? Why/not? 3) Calculate the mean for this set of data, show your working. 4) Are there any outliers in these results? If so, what would you do with them? 5) Do you think that this is a reliable method of collecting data on the pH of rain water in their town? Why/not? 6) What do you think they could have done to improve their investigation? Activity 3 A group of students were doing an experiment to see the effect of mass on the extension of a spring, they repeated each test three times, they got the following results 0g extension = 0cm, 0cm, 0cm, 50g extension = 2.4cm, 2.6cm, 2.4cm, 100g extension = 5.2cm, 4.9cm, 5.1cm 200g = 8.9cm, 9.9cm, 10.1cm, 400g extension = 20.7cm, 20.1cm, 20.4cm. 1) Draw a table to tabulate these results in. Leave a column to add the mean. 2) Work out the mean extension for each mass and add it to the table. Use the space to show your working. 3) Look at the range of data for each mass; do you think all their results are reliable? How can you tell? 4) Are there any outliers in their results, if so which ones? 5) What would you do with any outliers? 6) What impact would this have on your mean calculations, and therefore your conclusions? 7) What do you think might have caused any outliers? Activity 4 A student measures a distance of 1 meter using a trundle wheel in the school field. Another student then uses a meter stick to see how accurately the trundle wheel has measured the distance. The student finds that the distance measured by the trundle is actually only 97cm. 1) Calculate the percentage error of the trundle wheel reading, show your working. 2) The two students repeat this procedure again, and find out that the actual distance measured this time was 105cm. What is the percentage error for this reading? Activity 5 Three students decided to weigh an orange, an apple and a pear. The first student obtained the following results: orange = 77.4g, apple = 57.3g, pear = 67.4g. The second student weighed the same three fruits and got the following results: orange = 80.4g, apple = 50.3g, pear – 70.4g. The third student weighed the same three fruits and got these results: orange = 77.3g, apple = 57.3g, pear – 67.5g. 1) Do you think there are any errors in these results? 2) If so, what type of error is there? 3) Which students did this affect? 4) What might have caused this error? 5) What could the students have done to avoid this? 6)
