Scattering contrast dependence on the difference in the thermal
advertisement
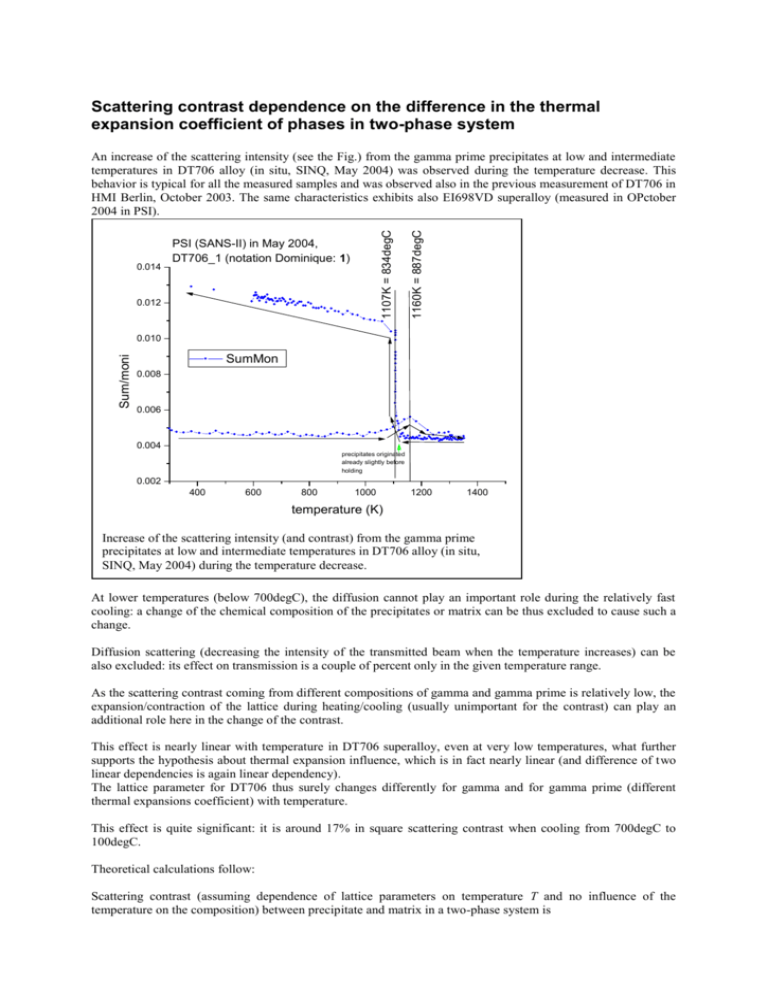
Scattering contrast dependence on the difference in the thermal expansion coefficient of phases in two-phase system PSI (SANS-II) in May 2004, DT706_1 (notation Dominique: 1) 0.012 1160K = 887degC 0.014 1107K = 834degC An increase of the scattering intensity (see the Fig.) from the gamma prime precipitates at low and intermediate temperatures in DT706 alloy (in situ, SINQ, May 2004) was observed during the temperature decrease. This behavior is typical for all the measured samples and was observed also in the previous measurement of DT706 in HMI Berlin, October 2003. The same characteristics exhibits also EI698VD superalloy (measured in OPctober 2004 in PSI). Sum/moni 0.010 SumMon 0.008 0.006 0.004 precipitates originated already slightly before holding 0.002 400 600 800 1000 1200 1400 temperature (K) Increase of the scattering intensity (and contrast) from the gamma prime precipitates at low and intermediate temperatures in DT706 alloy (in situ, SINQ, May 2004) during the temperature decrease. At lower temperatures (below 700degC), the diffusion cannot play an important role during the relatively fast cooling: a change of the chemical composition of the precipitates or matrix can be thus excluded to cause such a change. Diffusion scattering (decreasing the intensity of the transmitted beam when the temperature increases) can be also excluded: its effect on transmission is a couple of percent only in the given temperature range. As the scattering contrast coming from different compositions of gamma and gamma prime is relatively low, the expansion/contraction of the lattice during heating/cooling (usually unimportant for the contrast) can play an additional role here in the change of the contrast. This effect is nearly linear with temperature in DT706 superalloy, even at very low temperatures, what further supports the hypothesis about thermal expansion influence, which is in fact nearly linear (and difference of two linear dependencies is again linear dependency). The lattice parameter for DT706 thus surely changes differently for gamma and for gamma prime (different thermal expansions coefficient) with temperature. This effect is quite significant: it is around 17% in square scattering contrast when cooling from 700degC to 100degC. Theoretical calculations follow: Scattering contrast (assuming dependence of lattice parameters on temperature T and no influence of the temperature on the composition) between precipitate and matrix in a two-phase system is 2 T 2 b b p b p bm 3 1 31 3 m 3 a T a T a T a T b p p m m m 2 Then, ratio of contrasts at temperature T and at room temperature TR is T 2 R 2 1 1 b p 3 3 am T a p T bm 2 2 1 1 b p 3 3 amR a pR bm Using approximation of linear and constant thermal expansion coefficients http://en.wikipedia.org/wiki/Coefficient_of_expansion m 1 a mR a m T a mR T TR in the measured temperature range we arrive at T 2 R 2 1 T T 1a 3 m R mR 1 r m T TR 1a pR 3 b p bm 2 2 ratio of scattering contrasts at 700degC and at 100degC 1 1 b p 3 3 a bm mR a pR where r =αp/αm is the ratio of the thermal expansion coefficients of precipitate and matrix. The following graph is a simulation of the influence of r and of ratio of scattering lengths sum on the ratio of scattering contrasts at 700degC and at 100degC: F2 F3 F5 F4 1.2 sum(bP)/sum(bM) [ratio of sc.lengths over unit cell] simulation: 0.9 0.959 (i.e. 70E9/73E9) 0.98 1.00 1.1 simulation: matrix 3.559 A, precipitate 3.572 A at RT 1.0 DT706: sum(bP)/sum(bM) [ratio of sc.lengths over unit cell] estimated to be 0.959 (i.e. 70E9/73E9) 0.9 thermal expansion coefficient of matrix estimated to be 15.39E-6 (valid for IN706 at 400degC) 0.8 0.6 0.8 1.0 1.2 1.4 ratio of thermal expansion coefficients of precipitate and matrix In this simulations, lattice parameters of gamma and gamma prime of IN706 were used (see Appendix). Thermal expansion coefficient of matrix was used according to the data sheet of IN706 at http://www.specialmetals.com/products/inconelalloy706.htm It can be seen that the nearer the ratio of scattering lengths sum is to 1.0, the larger influence of the theremal expansion coefficient difference exists. The influence of misfit (and its evolution with temperature) on scattering contrast is larger in that case. The observed difference (DT706) 17% gives (for the realistic ratio of scattering lengths sum coming out from the SANS experiment and its modeling&fitting using NOC) the ratio r=0.88. With these values, the explanation of the observed behavior of DT706 during in-situ SANS using different thermal expansions for gamma and for gamma prime is realistic (see the next graph giving the simulated temperature dependence). 0.014 scattering contrast (rel. units) 0.012 0.010 0.008 F6 0.013* (1/((15.39E-6*(X-373)+1)*3.559)^3 1/((0.88*15.39E-6*(X-373)+1)*3.572)^3*0.959 )^2 / (1/(3.559)^3 - 1/(3.572)^3*0.959 )^2 0.006 0.004 0.002 400 600 800 1000 temperature (K) Misfit evolution with temperature is: r T T 1a T T 1a pR m R mR misfit 2 r mm T TRR 1a pR m T TR 1a mR In our case, particularly: 0.016 0.014 0.012 Y Axis Title 0.010 F8 (aprecip-amatrix) 0.008 F7 misfit = 2*(aprecip-amatrix)/(aprecip+amatrix) 0.006 0.004 0.002 0.000 0 200 400 600 X Axis Title 800 1000 Appendix Crystal Structure Data for Different Phases in Ni-base Alloys Symbol ' '' Phase Ni-(Al,Cr,..) Ni3Al Ni3Nb Ni3Ti Crystal Structure fcc (A1) ordered fcc (L12) bct (DO22) Hexagonal (DO24) Structure Type Cu AuCu3 Al3Ti Ni3Ti Space Group Fm 3bar m Pm 3bar m I4 / mmm P63 / mmc Pearson Symbol cF4 cP4 tI8 hP16 Space Gp. No. 225 221 139 194 Symbol Atom Type Ni Al Wyckoff no 4a 4a x y 0 0 0 0 No. Of Atoms per unit cell = 4 z 0 0 Al Ni 1a 3c 0 0 0 1/2 No. Of Atoms per unit cell = 4 0 1/2 1 1 '' 2a 2b 4d 0 0 0 0 0 1/2 No. Of Atoms per unit cell = 8 0 1/2 1/4 1 1 1 2a 2c 6g 6h 0 0 1/3 2/3 1/2 0 0.833 0.666 No. Of Atoms per unit cell = 16 0 1/4 0 1/4 1 1 1 1 Atom Positions Structrue Type Ni (Al) Lattice Parameter : a = 0.3559 nm Ni3Al ' Lattice Parameter : a = 0.35720 nm Ni3Nb Ni3Ti Nb Ni (1) Ni (2) Lattice Parameter : a = 0.362 nm; c = 0.741 nm Ti (1) Ti (2) Ni (1) Ni (2) Lattice Parameter : a = 0.51010 nm; c = 0.83067 nm; = 120° Tab. 1. Crystal Structure Data for Different Phases in Ni-base Alloy INCONEL 706. occupancy 0.5 0.5


