Empirical Method Test
advertisement
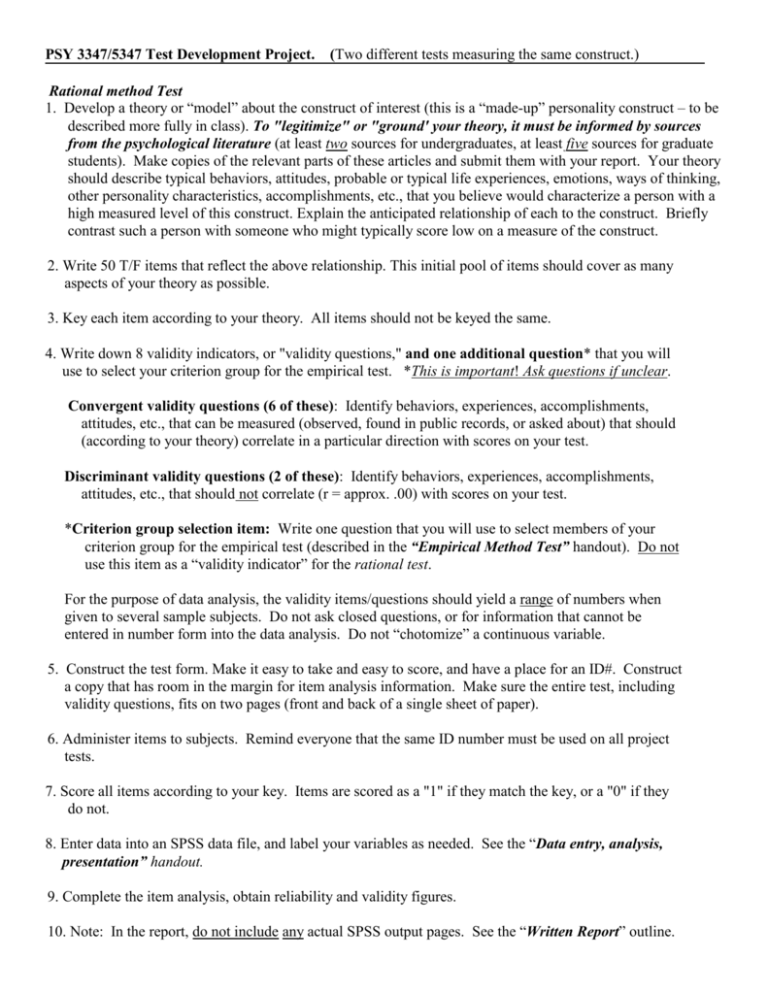
PSY 3347/5347 Test Development Project. (Two different tests measuring the same construct.) Rational method Test 1. Develop a theory or “model” about the construct of interest (this is a “made-up” personality construct – to be described more fully in class). To "legitimize" or "ground' your theory, it must be informed by sources from the psychological literature (at least two sources for undergraduates, at least five sources for graduate students). Make copies of the relevant parts of these articles and submit them with your report. Your theory should describe typical behaviors, attitudes, probable or typical life experiences, emotions, ways of thinking, other personality characteristics, accomplishments, etc., that you believe would characterize a person with a high measured level of this construct. Explain the anticipated relationship of each to the construct. Briefly contrast such a person with someone who might typically score low on a measure of the construct. 2. Write 50 T/F items that reflect the above relationship. This initial pool of items should cover as many aspects of your theory as possible. 3. Key each item according to your theory. All items should not be keyed the same. 4. Write down 8 validity indicators, or "validity questions," and one additional question* that you will use to select your criterion group for the empirical test. *This is important! Ask questions if unclear. Convergent validity questions (6 of these): Identify behaviors, experiences, accomplishments, attitudes, etc., that can be measured (observed, found in public records, or asked about) that should (according to your theory) correlate in a particular direction with scores on your test. Discriminant validity questions (2 of these): Identify behaviors, experiences, accomplishments, attitudes, etc., that should not correlate (r = approx. .00) with scores on your test. *Criterion group selection item: Write one question that you will use to select members of your criterion group for the empirical test (described in the “Empirical Method Test” handout). Do not use this item as a “validity indicator” for the rational test. For the purpose of data analysis, the validity items/questions should yield a range of numbers when given to several sample subjects. Do not ask closed questions, or for information that cannot be entered in number form into the data analysis. Do not “chotomize” a continuous variable. 5. Construct the test form. Make it easy to take and easy to score, and have a place for an ID#. Construct a copy that has room in the margin for item analysis information. Make sure the entire test, including validity questions, fits on two pages (front and back of a single sheet of paper). 6. Administer items to subjects. Remind everyone that the same ID number must be used on all project tests. 7. Score all items according to your key. Items are scored as a "1" if they match the key, or a "0" if they do not. 8. Enter data into an SPSS data file, and label your variables as needed. See the “Data entry, analysis, presentation” handout. 9. Complete the item analysis, obtain reliability and validity figures. 10. Note: In the report, do not include any actual SPSS output pages. See the “Written Report” outline. Empirical Method Test 1. Use the item pool of 50 T/F empirical items presented in class. These items address preferences or opinions on which people are likely to differ, but have no agenda, construct, or theory in common. They are “a-theoretical.” 2. Administer the pool of empirical/atheoretical items, and obtain an ID# from each person. “Item analysis” procedure 3. Isolate criterion group protocols from those of "people in general,” using the question you developed for this purpose (see #4 in the “Test Development Project” outline). 4. Calculate % of each group answering "True" on each item. Find the % difference (of these “True” responses) between the criterion group and the “people-in-general” group. 5. Retain the 25 items that show the greatest response difference between groups. These items are your test, developed via the empirical/contrast groups method. Keying and scoring 6. Key each of these 25 items in such a way that that more criterion group members will get a point for the item. 7. Score all items in the test according to your key. (Score only the 25 items that make up the test, the others did not discriminate well enough between groups, and therefore are irrelevant). Items are scored as a "1" if they match the key, or a "0" if they do not. 8. Obtain a total score for each “protocol,” or person, on your 25-item empirical test. 9. Match subjects' scores on the empirical scale with their scores on the revised rational scale, using the ID# that was provided for each. 10. Obtain reliability and validity figures. 11. Describe criterion levels from steps 4 and 5 above. See the “Written Report” outline. PSY 3347/5347 Test development project Data entry, analysis, presentation -- both tests Use SPSS... 1. Enter data after scoring both tests with their respective keys: Each subject's scores on both tests and the validity questions should be on one line. Name your variables so the output is understandable. 2. Calculate a total score for each subject on each test (Under "Transform"..."Compute" type your score name and the "sum" command. Example: totalr = sum(item1 to item50), and totale = sum(e1 to e25). DO NOT add your validity questions in as part of the sum of your test scores. 3. Obtain p-values (item means). Under "Analyze" ... "Descriptive Statistics" ... "Descriptives" enter all *rational items. Write each p-value down in one column next to the corresponding item on one of your test forms. 4. Obtain item-total correlations for rational items*. Under “Analyze” "Correlate"..."Bivariate" enter the 1st and last rational item names (e.g. "item1" "item50") and your total rational test score, (e.g. "totalr") . Hit "Paste" and change the 1st line command to (for example) "Item1 to Item50 with Totalr " Click on the little triangle button (looks like the "play" symbol on a tape recorder) on the tool bar at the top of the page. Write these correlations down (just use 2 decimal places) in a column next to your p-values. *Remember, only rational test items. P-values and item-total correlations are irrelevant for empirical test items. The “item analysis” for the empirical test was finished when you chose the items with the greatest % difference of “True” answers between your criterion group and the people-in-general group. 5. Obtain 2 estimates of reliability for the rational test (Use "Alpha" and "Split-Half") by entering all 50 rational test items under "Scale"..."Reliability Analysis." 6. Keep the 25 or more items that discriminate positively and most strongly, preferably with p-values as close to .50 as possible. Cross out the rest on your paper, then (after saving your initial data file) delete them from the data sheet. Also delete the total score for the 50 item rational test. In your final report, indicate the actual criteria you used to retain your "good" items. **From this point on, you will only be using this 25 item "revised" rational test.** Now, save your data file under a different file name. 7. Compute a new total score for your revised rational test of 25 items. 8. Obtain means and standard deviations for total scores on both (rational and empirical) 25-item tests. 9. Obtain reliability estimates (use the "Alpha" model – see #5 above) for both tests. (You are obtaining rxx and ryy in the formula for the "correction for attenuation"). Include these “alphas” in your report. 10. Correlate total scores on both tests with your validity items to obtain more validity evidence. (In your report, explain how each of these correlations support (or don't support) your theory, and explain which test seems to be more valid as a measure of self esteem, as your group conceptualized it. 11. Correlate the two tests with one another (total scores). This is the validity estimate that will be corrected for attenuation due to the error in both tests. 12. Calculate (use a hand calculator) SEM for both tests, and the correction for attenuation. Show the numbers used in your calculations in your report. PSY 3347/5347 Test Development Project. Written Report 1. Describe the name of the test, the construct being measured, and your theory about this construct. Make sure you include references to the psychological literature sources that have informed your theory. Attach to the end of this report copies of the relevant parts of these articles. Relate it to typical behaviors, attitudes, probable or typical life experiences, emotions, ways of thinking, other personality characteristics, accomplishments, etc., that you believe would characterize a person with a high measured level of this construct. Explain the anticipated relationship of each to the construct. Briefly contrast such a person with someone who might typically score low on a measure of the construct. Describe the questions you asked to obtain "validity information." 2. Include a keyed version/copy of each original test, along with item analysis information for each item. (These item analysis data can just be hand-written in the margin next to each item). Clearly identify the items that were retained for the final item analysis. You may do this by highlighting them or by crossing out the items not used. 3. a. Describe your criteria (include both discrimination and difficulty figures) for retaining the "best" items for the rationally developed test. b. Describe how you selected the criterion group, and the criterion level for group differences (the % difference) that you used to retain the most discriminating items for the empirical scale. Indicate the number of people in your criterion group. 4. The following may be presented in a table… a. For each test, present means and standard deviations for total scores. b. Include both coefficient alpha and the split half estimate for the original rational test. Include alpha for the revised version of the rational test and for the empirical test. c. Present the SEM for each 25-item test. Include all your calculations. d. Present the correlation between revised rational and empirical tests (validity). Comment on this correlation. e. "Correct" the above correlation for error with the "correction for attenuation." Show your calculations. 5. a. Describe other validity information, specifically, the correlations between each of your validity indicators/questions and the total scores in each test. Walk through your validity items one at a time, so that you are describing the meaning of each correlation, not the naming the item and stating a number. Describe your prediction or expectation for each one and the extent to which each of these validity coefficients (in strength and direction) matched your predictions or expectations. Some of the correlations do not match your expectations – to what do you attribute this? Present each of these correlations and explain them (or speculate about them if you can’t explain them). b. Which test appears to have higher validity and on what (specifically) do you base this opinion?

