1 Mathematics Item Specifications Grade HS, Target G Claim 1
advertisement
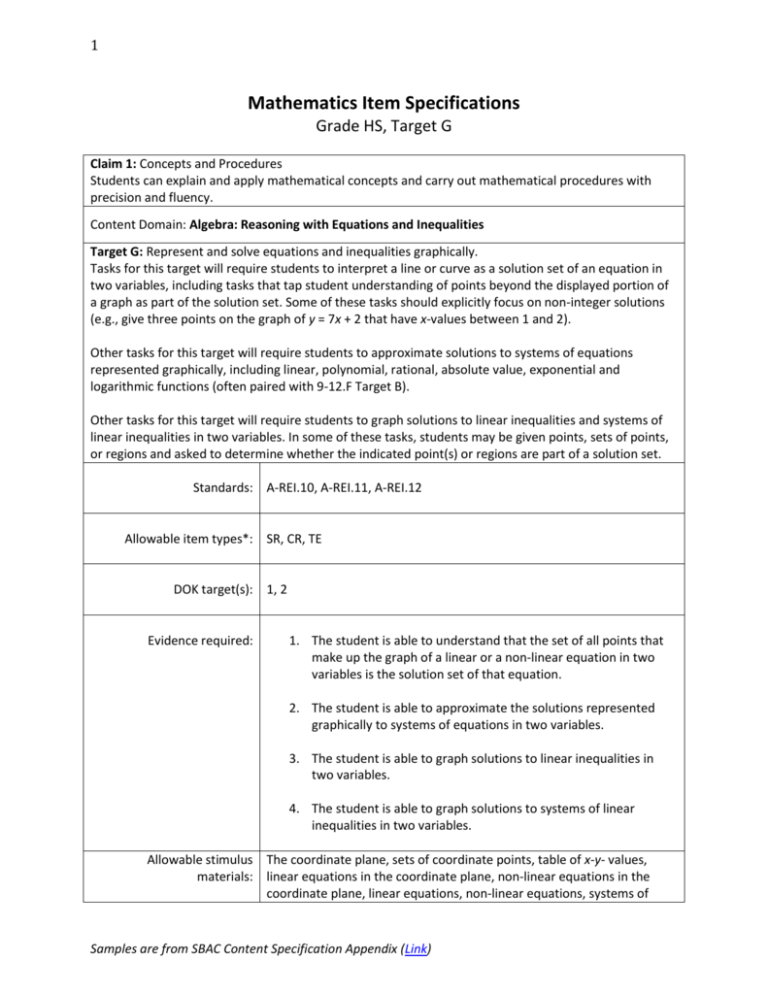
1 Mathematics Item Specifications Grade HS, Target G Claim 1: Concepts and Procedures Students can explain and apply mathematical concepts and carry out mathematical procedures with precision and fluency. Content Domain: Algebra: Reasoning with Equations and Inequalities Target G: Represent and solve equations and inequalities graphically. Tasks for this target will require students to interpret a line or curve as a solution set of an equation in two variables, including tasks that tap student understanding of points beyond the displayed portion of a graph as part of the solution set. Some of these tasks should explicitly focus on non-integer solutions (e.g., give three points on the graph of y = 7x + 2 that have x-values between 1 and 2). Other tasks for this target will require students to approximate solutions to systems of equations represented graphically, including linear, polynomial, rational, absolute value, exponential and logarithmic functions (often paired with 9-12.F Target B). Other tasks for this target will require students to graph solutions to linear inequalities and systems of linear inequalities in two variables. In some of these tasks, students may be given points, sets of points, or regions and asked to determine whether the indicated point(s) or regions are part of a solution set. Standards: A-REI.10, A-REI.11, A-REI.12 Allowable item types*: SR, CR, TE DOK target(s): 1, 2 Evidence required: 1. The student is able to understand that the set of all points that make up the graph of a linear or a non-linear equation in two variables is the solution set of that equation. 2. The student is able to approximate the solutions represented graphically to systems of equations in two variables. 3. The student is able to graph solutions to linear inequalities in two variables. 4. The student is able to graph solutions to systems of linear inequalities in two variables. Allowable stimulus The coordinate plane, sets of coordinate points, table of x-y- values, materials: linear equations in the coordinate plane, non-linear equations in the coordinate plane, linear equations, non-linear equations, systems of Samples are from SBAC Content Specification Appendix (Link) 2 linear and nonlinear equations in the coordinate plane, linear inequalities, linear inequalities in the coordinate plane, systems of linear inequalities, systems of linear inequalities in the coordinate plane, shaded regions in the coordinate plane Allowable disciplinary linear inequality with two variables, system of equations, system of vocabulary: inequalities, polynomial function, rational function, absolute value function, exponential function, logarithmic functions, solution set, coordinate plane (or coordinate grid), half-plane Allowable manipulative materials: Task models: 1. SR Prompt Features: The student is prompted to identify points located on a linear or non-linear graph in the coordinate plane or to identify the graph of an equation in two variables that contains a set of given points. Stimuli: The student is presented with a linear or non-linear graph in the coordinate plane and asked to identify solutions that are located on the graph. The solutions to be identified may or may not be visibly apparent on the stimulus (i.e., the student may need to interpolate to find noninteger solutions or extrapolate to identify solutions beyond the visible stimulus). The student may also be presented with a set of coordinate points, either in set notation or as a table of values, and asked to identify a linear or nonlinear graph that is represented by those points. The student may also be presented with a set of multi-part items that require yes/no or true/false responses that are scored according to a rubric. 1. CR Prompt Features: The student is prompted to find a solution set of coordinate points or complete a table of values for a linear or non-linear coordinate graph. The prompt may require the student to find a set of non-integer solutions, a set of solutions with x-values not visible on the graph, or a set of solutions with y-values not visible on the graph. Stimuli: The student is presented with a linear or non-linear graph in a coordinate plane and asked to find solutions that are located on the graph. The solutions to be identified may or may not be visibly apparent on the stimulus (i.e., the student may need to interpolate to find noninteger solutions or extrapolate to identify solutions beyond the visible stimulus). 1. TE Prompt Features: The student is prompted to graph the solution set for a linear or a non-linear equation in two variables. Stimuli: The student is presented with a linear or a non-linear equation in two variables. Interaction: The student uses a tool to plot points representing part of the solution set of the equation and draws a line to connect the points. Samples are from SBAC Content Specification Appendix (Link) 3 2. SR Prompt Features: The student is prompted to identify the approximate solution to a system of equations in two variables represented graphically on a coordinate plane. Stimuli: The student is presented with a system of equations graphed in the coordinate plane. The system may include two linear graphs, two non-linear graphs, or one linear and one non-linear graph. Non-linear graphs could include polynomial, rational, absolute value, exponential, and logarithmic functions. 3. SR Prompt Features: The student is prompted to identify the graphical region representing the solution set of a linear inequality in two variables. Or the student is prompted to identify a set of points representing the solution set of a linear inequality in two variables. Stimuli: The student is presented with a linear inequality in two variables. Or the student may be presented with a set of multi-part items that require yes/no or true/false responses that are scored according to a rubric. 3. CR Prompt Features: The student is prompted to graph the region representing the solution set of a linear inequality in two variables. Or the student is prompted to list a set of coordinate points representing the solution set of a linear inequality in two variables. Stimuli: The student is presented with a linear inequality in two variables and a blank coordinate plane. Or the student may be presented with a linear inequality in two variables and asked to identify a set of coordinate points that are part of its solution set. Or the student is presented with a graph in the coordinate plane of a linear inequality with no shaded region drawn and asked to shade the region, or half-plane, representing the solution set. 3. TE Prompt Features: The student is prompted to graph the solution set for a linear inequality in two variables. Stimuli: The student is presented with a linear inequality in two variables. Interaction: The student uses a tool to draw either a solid line or a dotted line to represent the graph of a linear inequality in two variables and shade the half-plane that represents the solution set to the inequality. 4. SR Prompt Features: The student is prompted to identify the graphical region representing the solution set of a system of linear inequalities in two variables. Or the student is prompted to identify a set of points representing the solution set of a system of linear inequalities in two Samples are from SBAC Content Specification Appendix (Link) 4 variables. Stimuli: The student is presented with a system of linear inequalities in two variables. Or the student may be presented with a set of multi-part items that require yes/no or true/false responses that are scored according to a rubric. 4. CR Prompt Features: The student is prompted to graph the region representing the solution set of a system of linear inequalities in two variables. Or the student is prompted to list a set of coordinate points representing the solution set of a system of linear inequalities in two variables. Stimuli: The student is presented with a system of linear inequalities in two variables and a blank coordinate plane. Or the student may be presented with a system of linear inequalities in two variables and asked to identify a set of coordinate points that are part of its solution set. Or the student is presented with a graph of a system of linear inequalities in two variables with no shaded region drawn and asked to shade the region representing the solution set. 4. TE Prompt Features: The student is prompted to graph the solution set for a system of linear inequalities in two variables. Stimuli: The student is presented with a system of linear inequalities in two variables. Interaction: The student uses a tool to draw either a solid line or a dotted line to represent the graph of each linear inequality and shades the intersection of the half-planes that represent the solution set to the system of inequalities. Key non-targeted constructs: Target-specific attributes: It will be a challenge to assess blind or low-vision students on this target. Accessibility concerns: It will be a challenge to assess physically disabled students on the TE items of this target. Sample items: 012 *SR = selected-response item; CR = constructed-response item; TE = technology-enhanced item; PT = performance task; Samples are from SBAC Content Specification Appendix (Link)
