Coordinates and Graphing tool – Activities for KS3 mathematics
advertisement
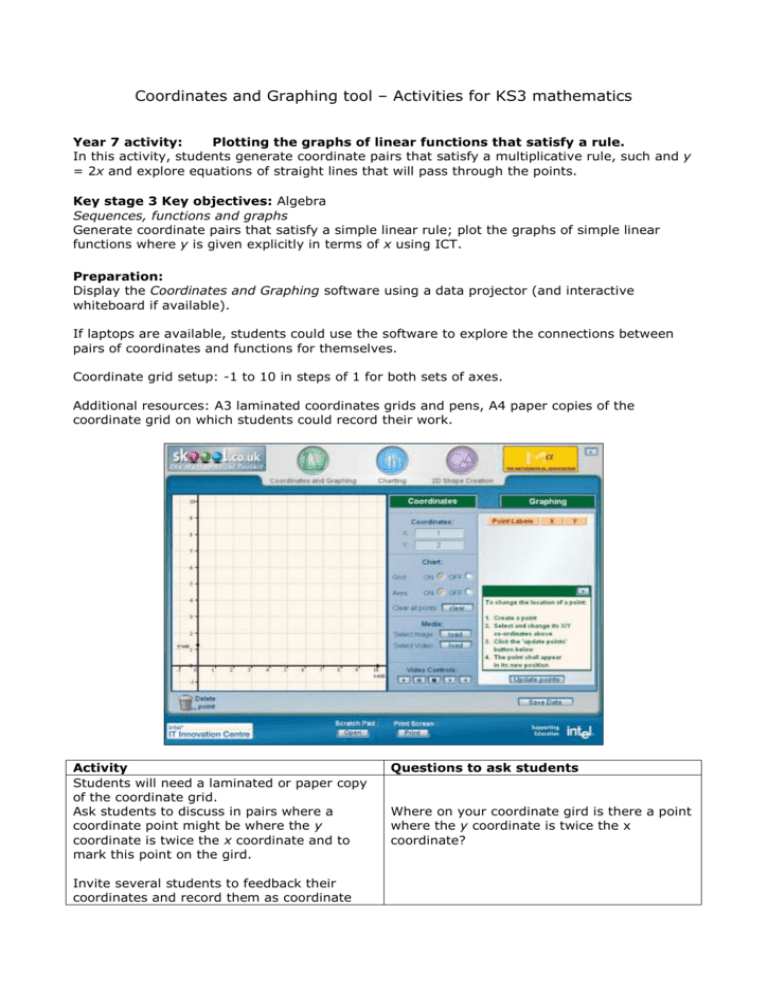
Coordinates and Graphing tool – Activities for KS3 mathematics Year 7 activity: Plotting the graphs of linear functions that satisfy a rule. In this activity, students generate coordinate pairs that satisfy a multiplicative rule, such and y = 2x and explore equations of straight lines that will pass through the points. Key stage 3 Key objectives: Algebra Sequences, functions and graphs Generate coordinate pairs that satisfy a simple linear rule; plot the graphs of simple linear functions where y is given explicitly in terms of x using ICT. Preparation: Display the Coordinates and Graphing software using a data projector (and interactive whiteboard if available). If laptops are available, students could use the software to explore the connections between pairs of coordinates and functions for themselves. Coordinate grid setup: -1 to 10 in steps of 1 for both sets of axes. Additional resources: A3 laminated coordinates grids and pens, A4 paper copies of the coordinate grid on which students could record their work. Activity Students will need a laminated or paper copy of the coordinate grid. Ask students to discuss in pairs where a coordinate point might be where the y coordinate is twice the x coordinate and to mark this point on the gird. Invite several students to feedback their coordinates and record them as coordinate Questions to ask students Where on your coordinate gird is there a point where the y coordinate is twice the x coordinate? pairs on the board, or paper for the class to see. Invite students to plot their points on the coordinate grid. What do you notice about all of the coordinates? Support the students to “translate” the sentence in words to one that uses algebra. If we were to write a sentence to describe how the coordinates are related to each other, what could we write? Move to the Graphing page and invite a student to enter y = 2x as a function and draw the graph. Show the table of values for the function y = 2x and discuss this with students. Highlight the fact that the coordinate pairs that they generated and the x and y values in the table represent the same information. Give pairs of students different relationships in words of the form y = mx to explore. For example, “the y coordinate is always one and a half times the x coordinate.” For each one, ask the students to generate some coordinates, and use the Coordinates and Graphing software to plot them on the coordinate grid. Students then predict the function and test their predictions using the software. Students can then use the table of values to check their coordinates. During the plenary, invite students to feedback their rules and the equations that they found. What do you notice about all of the straight lines that we have looked at during the activity? What sort of rules produced steep lines? What coordinate point do all of the straight lines pass through? Year 9 more able activity: Introduction to solving simultaneous equations. In this activity, students are introduced to the concept of simultaneous equations by first considering a particular coordinate and the possible lines that might pass through this point. They then make connections between pairs of equations and justify why any pair of equations lead to a particular solution. In doing so, students consolidate strategies for rearranging algebraic statements, including changing the subject of equations. Key stage 3 Key objectives: Algebra Equations, formulae and identities Solve a pair of simultaneous linear equations by eliminating one variable; link a graphical representation of an equation or a pair of equations to the algebraic solution; consider cases that have no solution or an infinite number of solutions. Preparation: Display the Coordinates and Graphing software using a data projector (and interactive whiteboard if available). If laptops are available, students could use the software to conjecture and test pairs of equations that pass through the same coordinate point and justify. Coordinate grid setup: -10 to 10 in steps of 1 for both sets of axes. Additional resources: A3 laminated coordinates grids and pens, A4 paper copies of the coordinate grid on which students could record their work. Activity Begin by choosing a coordinate point, for example, (3, -4) and asking students to discuss how they could create an equation of a straight line that would pass through that particular point. Invite a student to plot the point on the screen. Invite students to give their equations and make a list of five or six equations on the board. Discuss the equations that have been produced. For example, if students had suggested the equations y = x + 7 and y = 2x + 10, support the students to understand that this would mean that 2x – 10 = x – 7, leading to a solution of x = 3. Also that substituting x = 3 into either of the straight line equations would give y = -4. Use the Graphing tool to plot the straight lines Questions to ask students Can you come up with an equation of a straight line that you know will pass through the point (3, -4)? How can you prove that the line will pass through this point without drawing it? How can you prove that the straight line equations y = x + 7 and y = 2x + 10 would cross at (3, -4)? to show the point of intersection. Give students the opportunity to choose any two of the equations from the list they produced and work through the algebra to prove that the straight lines do in fact intersect at (3, -4). If students did not suggest any straight lines with a negative gradient, such as y = -x -1, introduce an equation of this type and give students the opportunity to work this through. Now, provide students with a list of straight line equations including some that are parallel and some that are equivalent from which students choose two and find if and where they intersect. A suitable list might be: y=2 y = 3(x - 1) y = -2x + 2 y = 3x – 3 y = -x + 5 Encourage pupils to use their understanding of the algebra to make some predictions and use the Coordinates and Graphing tool to check their predictions. If we had two straight lines, y = 3x - 3 and y = -x + 5, how could we predict where they would intersect?

