Geometry & Finite H Name
advertisement
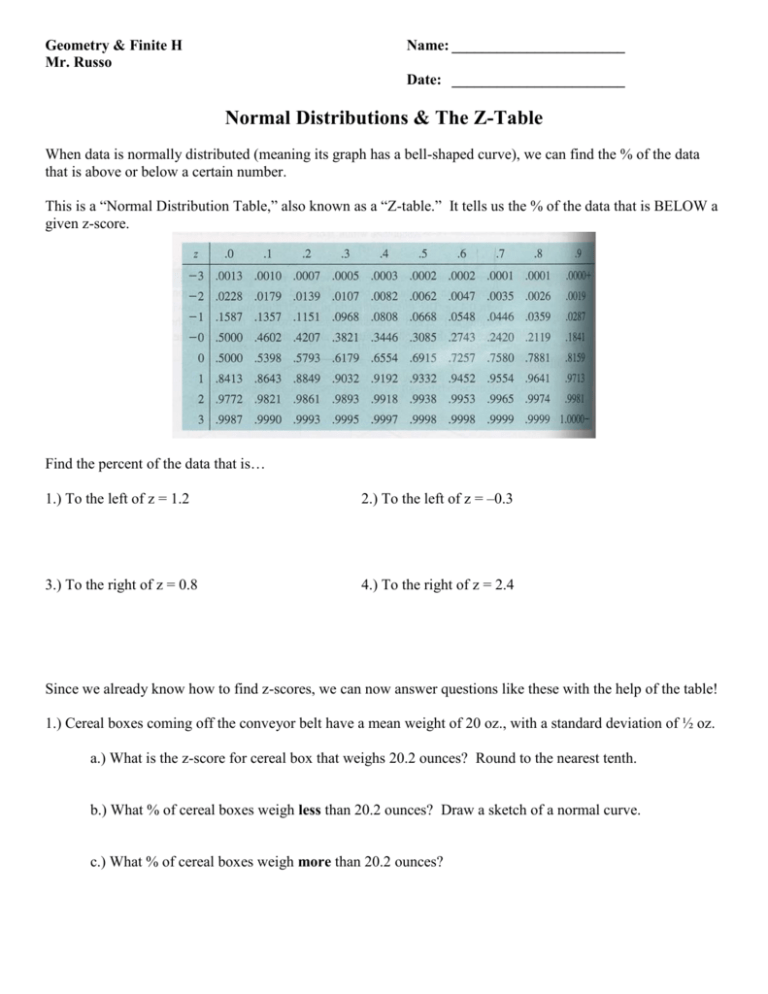
Geometry & Finite H Mr. Russo Name: _______________________ Date: _______________________ Normal Distributions & The Z-Table When data is normally distributed (meaning its graph has a bell-shaped curve), we can find the % of the data that is above or below a certain number. This is a “Normal Distribution Table,” also known as a “Z-table.” It tells us the % of the data that is BELOW a given z-score. Find the percent of the data that is… 1.) To the left of z = 1.2 2.) To the left of z = –0.3 3.) To the right of z = 0.8 4.) To the right of z = 2.4 Since we already know how to find z-scores, we can now answer questions like these with the help of the table! 1.) Cereal boxes coming off the conveyor belt have a mean weight of 20 oz., with a standard deviation of ½ oz. a.) What is the z-score for cereal box that weighs 20.2 ounces? Round to the nearest tenth. b.) What % of cereal boxes weigh less than 20.2 ounces? Draw a sketch of a normal curve. c.) What % of cereal boxes weigh more than 20.2 ounces? With our z-table, to find the % LESS than a given value: o Find the z-score of the value, then look up the proportion in the z-table With our z-table, to find the % MORE than a given value: o Find the z-score of the value, then look up the proportion in the z-table o Subtract that value from 1. 2.) The average age of doctors in a certain county is 45.6 years old. Suppose the distribution of ages is normal and has a of 4.1 years. If a doctor is randomly selected, what is the probability that the doctor is… a.) younger than 40 years old? Draw a sketch. b.) younger than 35 years old? Draw a sketch. c.) younger than 60 years old? Draw a sketch. d.) older than 60 years old? e.) between 40 and 60 years old? f.) About how old are the oldest 10% of doctors? (Hint: look in the table for the entry closest to 90%.) 3.) The average number of vacation days for a 1st year employee in a particular country is 10. Suppose the distribution of number of vacation days is normal and has a standard deviation of 2.5. Fill in the normal curve for the situation. a.) If a 1st year employee is randomly selected, what is the probability that her number of vacation days is less than 6? b.) If a 1st year employee is randomly selected, what is the probability that her number of vacation days is more than 13? c.) If a 1st year employee is randomly selected, what is the probability that her number of vacation days is less than 5 or more than 12? d.) If Dan is a 1st year employee who has 12 vacation days, what percentile does he fall in? What does that mean? CLOSURE: We can use the z-score in conjunction with the z-table to find the proportion of data that will fall above and below a specific value. Our given z-table shows values for the % that falls below that specific value. This is also the probability that a piece of data falls below (or to the left of) the given value! HW 5 1.) 2.) 3.) Find this percentage of people. 4.) The scores of a reference population on the Wechsler Intelligence Scale for Children (WISC) are approximately Normally distributed with a mean of 100 and a standard deviation of 15. Draw the normal curve with one, two and three standard deviations clearly indicated on the graph. a.) What score would represent the 50th percentile? Explain. b.) What proportion of the reference population has WISC scores below 110? What percentile does this score represent? Explain in a sentence. c.) What score would represent the 90th percentile? Explain. d.) A score in what range would represent the top 1% of the scores?
