Evaluation of the Large Particle Inlet (LPI) in a Wind Tunnel
advertisement
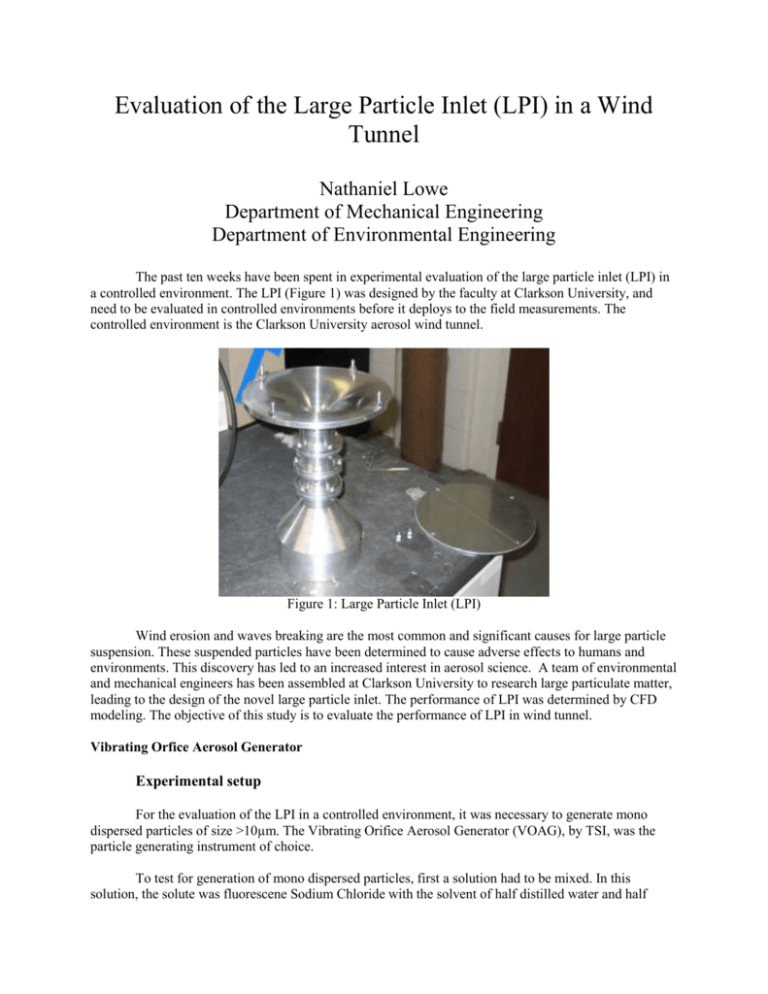
Evaluation of the Large Particle Inlet (LPI) in a Wind Tunnel Nathaniel Lowe Department of Mechanical Engineering Department of Environmental Engineering The past ten weeks have been spent in experimental evaluation of the large particle inlet (LPI) in a controlled environment. The LPI (Figure 1) was designed by the faculty at Clarkson University, and need to be evaluated in controlled environments before it deploys to the field measurements. The controlled environment is the Clarkson University aerosol wind tunnel. Figure 1: Large Particle Inlet (LPI) Wind erosion and waves breaking are the most common and significant causes for large particle suspension. These suspended particles have been determined to cause adverse effects to humans and environments. This discovery has led to an increased interest in aerosol science. A team of environmental and mechanical engineers has been assembled at Clarkson University to research large particulate matter, leading to the design of the novel large particle inlet. The performance of LPI was determined by CFD modeling. The objective of this study is to evaluate the performance of LPI in wind tunnel. Vibrating Orfice Aerosol Generator Experimental setup For the evaluation of the LPI in a controlled environment, it was necessary to generate mono dispersed particles of size >10µm. The Vibrating Orifice Aerosol Generator (VOAG), by TSI, was the particle generating instrument of choice. To test for generation of mono dispersed particles, first a solution had to be mixed. In this solution, the solute was fluorescene Sodium Chloride with the solvent of half distilled water and half isopropanol. This was the preferred method to mix solution as simply varying the concentration of the solute changed the size of particles generated by the VOAG. The VOAG was set up in line with an Aerosol Particle Sizer (APS) (Figure 3), that provides particle number concentration binned in particle aerodynamic diameters. The VOAG was then placed in the wind tunnel and tested against a passive impactor (Figure 5). Figure 3: VOAG in lined with APS to measure size and verify mono dispersity of particles Figure 5: Wind tunnel test of VOAG with the passive impactor Results and Discussion The APS measured the particles generated by the VOAG and made a plot of particle aerodynamic diameter versus particle count (Figure 4). Results from the VOAG wind tunnel experiments revealed that the VOAG generated mono dispersed particles with an optimal standard deviation of 1.18. The VOAG also produced particles of size prescribed by the user. The solution used was mixed to produce particles of size 7μm, Figure 4 gives the mean size of the mono dispersed particles to be 6.8μm. Figure 4: APS plot of particle diameter vs. particle count From the wind tunnel test of the VOAG with the passive impactor, the filter was analyzed under microscope and it was found that although the VOAG generated mono dispersed particles of correct size, the quantity of particles was insufficient. The concentration of particles when injected into in the wind tunnel was too low. Various injection methods were tested in an attempt to reduce dispersion of the particles and increase concentration at desired locations in the wind tunnel. In the end, the attempts to increase the concentration were unsuccessful. Another stumbling block faced with the VOAG was the inability of the APS to measure particles of large sizes (~30-40μm). This put complete dependence on the solution concentrations to being accurate and generate particles of the prescribed size. The particles were sampled by the passive impactor and examined under the microscope. Analysis showed that the particle size distribution was not accurate: when the prescribed particle size was 40μm, particles of size 32μm were generated. Another problem was that the stream of solution was too concentrated that the VOAG was unable to vaporize the water and isopropynol leaving excessive amounts of solution running down the sides of the vaporization chamber. This greatly reduced the concentration of the particles generated and collected on the impactor. In the end the VOAG was removed from the project. Dust Feeder Experimental Setup A dust feeder was used in place of the VOAG for generating micro particles in the wind tunnel. Glass beads of type 4000A, 5000A and 6000A were injected into the wind tunnel through various methods: horizontal injection, vertical injection and angled vertical injection (Figure 6). In the experimental setup, passive impactors and MOUDI impactors were alternately coupled with the LPI to filter the micro particulates from the wind stream. Figure 6: Horizontal, vertical, and angled vertical injection methods Results and Discussion Two methods were used to analyze the particles collected from the dust feeder experiments. The mass of each filter was taken before and after each experiment. Ideally, the change in mass would be used with the known density of the glass beads to calculate particle diameter, assuming the glass beads were perfectly spherical. The change in mass was not substantial and so analysis via microscope was implemented. From the microscope slide of the LPI filter (Figure 7) it is evident that the LPI does sample the large particles from the dust feeder. Figure 7: Microscope analysis of LPI filter from dust feeder experiment Results from the experiment with three passive impactors coupled with the LPI were tabulated and graphed (Figures 8a,b). From the table (Figure 8a), the results for the LPI at wind speeds 5m/s and 7 m/s is expected. The particles sampled by the LPI should decrease with increasing wind velocity. Particles at higher wind speeds have increased inertia allowing more particles to pass across the mouth of the LPI instead of being sampled in. The concentration of particles in the central (C) impactor is higher than the LPI. The C impactor is located in the center of the air stream where the LPI was located but in a horizontal position as opposed to the LPI’s vertical positioning, allowing for the inertia of the particles to work for the impactor instead of against it as with the LPI. The graph of the results from the experiment with the three passive impactors (Figure 8b) affirms that the LPI is performing as designed to collect large micro particles. When particle diameter is in the 30-50µm range, the LPI samples a much larger count of particles than any of the passive impactors. Concentration µg/cm3 Passive Impactors L C R LPI 2m/s 0.0207 0.0870 0.0622 0.0105 12% 3.5m/s 0.0450 0.0853 0.0426 0.0000 0% 5m/s 0.0033 0.0879 0.0232 0.0273 31% 7m/s 0.0000 0.0699 0.0000 0.0195 28% Figure 8a: Table of results from three impactors and LPI experiment Table 8b: Graph of data from three impactor and LPI experiment Several things can be concluded from the research performed over the past ten weeks. The hardest part to aerosol science experimentation is the tests in which monodispersed particles need to be generated. No ideal instrument and technique was found for the purpose detailed in this paper. From the dust feeder experiments, it was determined, through microscope analysis and measurement of the particle size distribution, that the LPI was effective in collecting particulates of size >10m. Insufficient results were obtained for the purpose of comparing against FLUENT models. Undergraduate 2008, Mechanical Engineering, Environmental REU, Sang-Rin Lee, Suresh Dhaniyala, Thomas Holsen, Andrew May
