Supplementary Information
advertisement
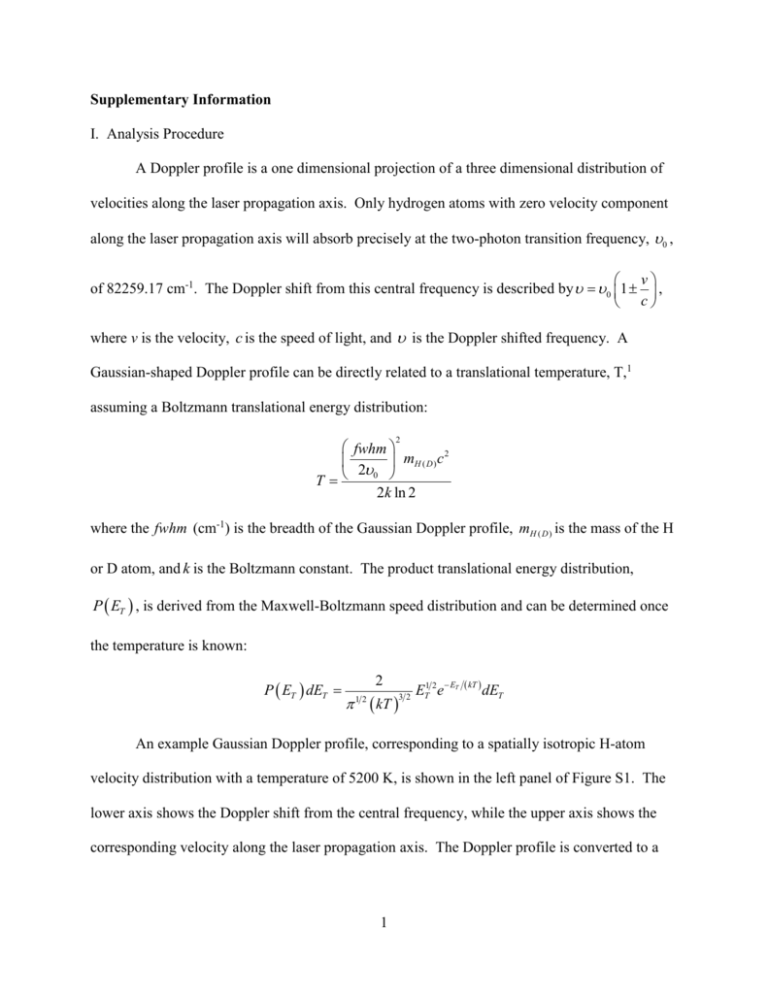
Supplementary Information I. Analysis Procedure A Doppler profile is a one dimensional projection of a three dimensional distribution of velocities along the laser propagation axis. Only hydrogen atoms with zero velocity component along the laser propagation axis will absorb precisely at the two-photon transition frequency, 0 , v of 82259.17 cm-1. The Doppler shift from this central frequency is described by 0 1 , c where v is the velocity, c is the speed of light, and is the Doppler shifted frequency. A Gaussian-shaped Doppler profile can be directly related to a translational temperature, T,1 assuming a Boltzmann translational energy distribution: 2 fwhm 2 mH ( D ) c 20 T 2k ln 2 where the fwhm (cm-1) is the breadth of the Gaussian Doppler profile, mH ( D ) is the mass of the H or D atom, and k is the Boltzmann constant. The product translational energy distribution, P ET , is derived from the Maxwell-Boltzmann speed distribution and can be determined once the temperature is known: P ET dET 2 12 kT 32 ET1 2e ET kT dET An example Gaussian Doppler profile, corresponding to a spatially isotropic H-atom velocity distribution with a temperature of 5200 K, is shown in the left panel of Figure S1. The lower axis shows the Doppler shift from the central frequency, while the upper axis shows the corresponding velocity along the laser propagation axis. The Doppler profile is converted to a 1 translational energy distribution using the above procedure in the right panel of Figure S1. Note that this conversion is exact in the case of a Gaussian shaped Doppler profile. The Gaussian Doppler profile is also fit using the new analysis procedure described in the main text. A discrete basis set is fit to the Doppler profile in a chi-squared minimization routine by varying the weighting of each velocity component. A discrete set of velocity components spaced by ~1800 m/s, corresponding to the experimental linewidth (0.5 cm-1), is utilized. The resultant fit is shown as a jagged line in the left hand panel of Figure S1. The weighting of the velocity basis functions yields the speed distribution. This is converted to the translational energy distribution, P(ET), shown as discrete points in the right hand panel of Figure S1. The new analysis method yields a discrete translational energy distribution which reproduces that obtained using the Maxwell-Boltzmann distribution, although limited by the experimental resolution. A finer grid of velocity basis functions would yield an improved fit to the Doppler profile and overall decrease in uncertainty for the corresponding P(ET) distribution. As evident in Figure S1, there is larger uncertainty in the weighting of the discrete basis functions at low ET, corresponding to small Doppler shifts, than at higher ET with larger Doppler shifts. This arises because a greater number of basis functions can potentially contribute to the fit of the Doppler profile near line center than in the wings. This uncertainty is combined with the experimental uncertainty derived from repeated measurements of the Doppler profiles, typically 10-15%, to give the error bars in the P(ET) distributions presented in Figure 4 of the main text. II. Reanalysis of H/D-atom Doppler profiles from OH A 2+ + D2 The previously published H/D-atom Doppler profiles5 resulting from reactive quenching of OH A 2+ by D2 have been reanalyzed here using the new analysis procedure. The summed 2 discrete step functions representing the best fits from the new analysis procedure are superimposed on the Doppler profiles in Figure S2. These fits are transformed into the P(ET) distributions shown in Figure 4 (middle panels) of the main text. The earlier analysis of the D-atom Doppler profile was based on the sum of two Gaussian functions, which necessarily gave rise to a bimodal P(ET) distribution. The revised analysis of the D-atom Doppler profile (Figure S2), which makes no assumption of its functional form, yields a notably different P(ET) distribution that can be viewed as a primary peak at low ET with a long tail extending out to higher energies as shown in Figure 4 of the main text. The shape of the P(ET) distribution can be reasonably well represented using either one or two lognormal distributions. Thus, the P(ET) distribution derived from the new analysis does not lead to an obvious separation into two distinct components as had been reported previously.5 In the prior analysis of the H-atom Doppler profile from OH A 2+ by D2, the data was fit to a single Gaussian function, neglecting points near line center that were noisy. This led to a broad P(ET) distribution with an average translational energy of 1.8 eV. Newer data acquired in the present work for other isotopic variants show highly effective background subtraction near line center (see Figure 2, main text), and thus the entire data set is included in reanalysis of the H-atom Doppler profile from OH A 2+ + D2, including points near line center. The revised analysis results in a different P(ET) distribution, which is modeled much better with the sum of two lognormal distribution functions as compared to a single lognormal function. The P(ET) distribution exhibits a distinctive peak at 1.8 eV and suggests a smaller peak at low ET. III. Revised analysis of H-atom Doppler profile for OH A 2+ + H2 Doppler measurements for the H-atom products from reactive quenching of OH A2+ by H2 were repeated in the present study and analyzed using the new fitting procedure, as shown in 3 Figure S3. This gives essentially the same P(ET) distribution as that derived from reanalysis of previously reported data.3 As discussed in the main text, this P(ET) distribution shows a prominent peak at low translational energies followed by a secondary broader peak at approximately 2.6 eV with a tail that extends to the energetic limit. The previously reported P(ET) distribution, based on the original Gaussian fitting procedure (sum of two Gaussian functions), had a similar bimodal shape but with somewhat different characteristics: It had a narrow component at low translational energy (0.15 eV) and a broad component at higher energy with average ET of 2.0 eV.3,5 Again, the new analysis (and subsequent results) is preferred because it makes no implicit assumption of the functional form of the Doppler profile. The properties of the product translational energy distributions following reactive quenching of OH A 2+ by H2 and its isotopic variants are summarized in Table S1. 4 Figure S1. Example Gaussian Doppler profile (left panel) plotted as a function of Doppler shift and velocity. The corresponding translational energy distribution (right panel) can be directly determined using a Maxwell-Boltzmann distribution (solid line). The Gaussian Doppler profile is also fit using a new analysis procedure, which makes no assumption of the functional form of the Doppler profile, and the resultant summed discrete step functions are shown (left panel). The P(ET) distribution obtained using the new analysis procedure (black circles, right panel) reproduces that derived from the Gaussian Doppler profile. 5 Figure S2. Doppler profiles arising from quenching of OH A 2+ by D2, with original data (open circles) reproduced from Todd et al. (Ref. 5) and refit using the new analysis method. The left and right panels show the D- and H-atom Doppler profiles for the D + HOD and H + D2O product channels, respectively. The summed discrete step functions representing the best fits from the new analysis procedure are superimposed on the Doppler profiles. 6 Figure S3. Doppler profile of the H-atom products resulting from quenching of OH A 2+ by H2, as repeated in the present study (open circles). The fit through the data is the summation of the discrete velocity basis functions from the new analysis procedure. 7 Table S1. Parameters characterizing product translational energy distribution following reactive quenching of OH A 2+ by H2 and its isotopic variants. Average energy released into product translation ET , fraction of available energy Eavail deposited into translation of products fT , and fractional contribution from abstraction or insertion product channel are listed. ET (eV) fT Product Channel OH A 2+ + H2 → H + H2O ( Eavail = 4.72 eV)a Anderson et al.b 0.84 0.18 Fu et al.c 0.74 0.16 0.99 (abstraction) Fu et al.c 1.3 0.28 0.01 (insertion) OH A 2+ + D2 → D + HOD ( Eavail = 4.72 eV)a Todd et al.d 0.56 0.12 0.57 Fu et al.c 1.2 0.26 0.98 (abstraction) Ortiz-Suarez et al.e 0.8 0.16 (abstraction) OH A 2+ + D2 → H + D2O ( Eavail = 4.80 eV)a Todd et al.d 1.1 0.23 0.43 Fu et al.c 1.3 0.27 0.02 (insertion) OD A 2+ + H2 → H + HOD ( Eavail = 4.71 eV)a This work 0.48 0.10 0.75 OD A 2+ + H2 → D + H2O ( Eavail = 4.64 eV)a This work 0.82 0.18 a 0.25 Eavail takes into account changes in OH/OD transition frequency, zero-point energy for the different isotopes of water (Ref. 2), and Ecoll ~ 0.005 eV. b Analysis using new method for H-atom Doppler profile from this work and Ref. 3. c Trajectory calculations from Ref. 4. d Reanalysis of H- and D-atom Doppler profiles from Ref. 5. 8 e Crossed molecular beam study from Ref. 6 with Ecoll ~ 0.16 eV. 9 References 1 R. N. Zare and D. R. Herschbach, Proc. IEEE 51, 173 (1963). 2 M. W. Chase, J. L. Curnutt, J. R. Downey, R. A. McDonald, A. N. Syverud, and E. A. Valenzuela, J. Phys. Chem. Ref. Data 11, 695 (1982). 3 D. T. Anderson, M. W. Todd, and M. I. Lester, J. Chem. Phys. 110, 11117 (1999). 4 B. Fu, E. Kamarchik, and J. M. Bowman, J. Chem. Phys. 133, 164306 (2010). 5 M. W. Todd, D. T. Anderson, and M. I. Lester, J. Phys. Chem. A 105, 10031 (2001). 6 M. Ortiz-Suárez, M. F. Witinski, and H. F. Davis, J. Chem. Phys. 124, 201106 (2006). 10

