EM04
advertisement
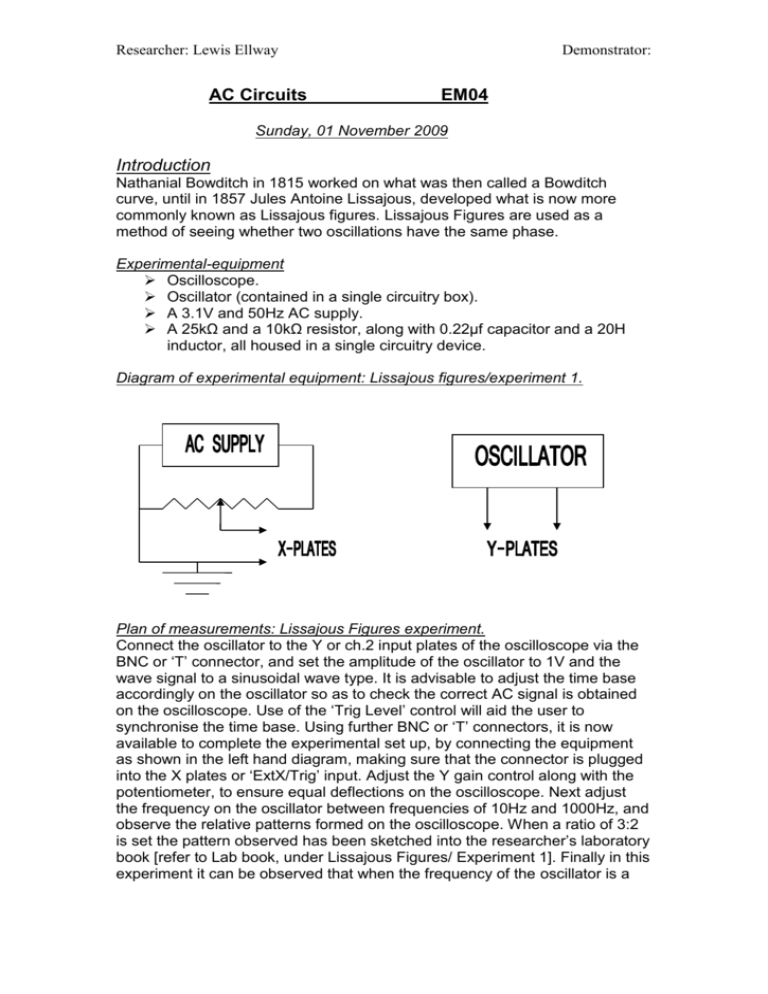
Researcher: Lewis Ellway AC Circuits Demonstrator: EM04 Sunday, 01 November 2009 Introduction Nathanial Bowditch in 1815 worked on what was then called a Bowditch curve, until in 1857 Jules Antoine Lissajous, developed what is now more commonly known as Lissajous figures. Lissajous Figures are used as a method of seeing whether two oscillations have the same phase. Experimental-equipment Oscilloscope. Oscillator (contained in a single circuitry box). A 3.1V and 50Hz AC supply. A 25kΩ and a 10kΩ resistor, along with 0.22μf capacitor and a 20H inductor, all housed in a single circuitry device. Diagram of experimental equipment: Lissajous figures/experiment 1. Plan of measurements: Lissajous Figures experiment. Connect the oscillator to the Y or ch.2 input plates of the oscilloscope via the BNC or ‘T’ connector, and set the amplitude of the oscillator to 1V and the wave signal to a sinusoidal wave type. It is advisable to adjust the time base accordingly on the oscillator so as to check the correct AC signal is obtained on the oscilloscope. Use of the ‘Trig Level’ control will aid the user to synchronise the time base. Using further BNC or ‘T’ connectors, it is now available to complete the experimental set up, by connecting the equipment as shown in the left hand diagram, making sure that the connector is plugged into the X plates or ‘ExtX/Trig’ input. Adjust the Y gain control along with the potentiometer, to ensure equal deflections on the oscilloscope. Next adjust the frequency on the oscillator between frequencies of 10Hz and 1000Hz, and observe the relative patterns formed on the oscilloscope. When a ratio of 3:2 is set the pattern observed has been sketched into the researcher’s laboratory book [refer to Lab book, under Lissajous Figures/ Experiment 1]. Finally in this experiment it can be observed that when the frequency of the oscillator is a Researcher: Lewis Ellway Demonstrator: integer multiple of 50Hz, then the pattern displayed by the Cathode ray oscilloscope should be a stationary wave. The ratio of the frequencies to Is determined by how points of intersection there are on the curve. Use this ratio and the pattern observed to calculate the error in the frequency due to the dial settings on the oscillator. Diagram of Experimental equipment: Phase Ellipse/ Experiment 2. Oscillator 25kΩ 10kΩ 0.22μF Earthed Earthed Plan of measurements: Phase Ellipses Experiment. Once the circuit displayed in the diagram above has been set up accordingly. Adjust the oscilloscope and oscillator, so that the amplitude of the X and Y deflections are of a similar magnitude. Thus making the oscilloscope convenient for taking measurements, it is also possible that the potentiometer may need adjusting. When connected simultaneously into the X and Y plates a phase ellipse should be seen on the Oscilloscope display screen. By using the graticule rotation knob on the oscilloscope it is possible for the experimenter to record and see whether the ratios of minor to major axes on the ellipse are consistent with theory. Repeated readings at various frequencies will further help to test the results against the associated theory. Diagram of Experimental equipment: Transients/Experiment 3 Researcher: Lewis Ellway Demonstrator: Circuitry Diagram LR Circuit. Circuitry Diagram CR Circuit. Oscillator Oscillator 10kΩ 0.22μF 10H 10kΩ Earthed Earthed Oscilloscope Oscilloscope Circuitry Diagram for LCR Circuit Experiment Oscillator 20kΩ 0.002μF 20H Earthed Plan of measurements: Transients Experiment. In a CR and LR Circuit. By switching the oscillator to the square wave function mode and setting up the circuit according to the circuitry diagram above for CR and LR circuits. An inspection of the oscilloscope as the square wave form is initiated on the oscillator, should display a square wave function on the screen. When either of the above circuits are connected the wave pattern displayed should be revolutionised into a new wave display that is shown later in the report in the results section. The experimenter is recording the time taken for the wave to rise to 63% or 1/e of its maximum value or alternatively for the wave to fall by 33% or 1-(1/e) of the wave’s maximum value. Use of the time base and the time base calibration control will ensure that the measurement of the time taken for the wave to rise or fall is as accurate as possible. Researcher: Lewis Ellway Demonstrator: In a LCR Circuit. First the researcher must adhere to the lower value capacitor which has the value of 0.002μF, opposed to the value of 0.22μF used in the previous experiments. Initially start by setting up the circuit according to the diagram above for the LCR circuit. The time base on the oscillator here will be essential to making sure the researcher is able to read the results with ease, while enabling the results to withstand a scale of accuracy. Furthermore the oscillator frequency should be kept low to ensure that the observer or experimenter is able to distinguish between wave peaks during decaying oscillations. Safety Procedures. For the three experiments, the commonality between them is that mains electricity is being used and therefore standard electrical safety precautions should be taken. But in addition to this the researcher, should ensure that always where the circuits have been earthed or grounded to make sure that this is done so, to avoid the user being electrocuted. Other devices that may cause interference should try to be removed, as it may endanger the safety of the experimenter, while also causing inaccuracies in the results. Results. Lissajous Figures Experiment The results for the frequency ratio of 3:2 are on display in my laboratory book. When the oscillator frequency was an integer or multiple of the 50Hz mains frequency, a stationery pattern was obtained, however the pattern was distort and this is discussed in the discussion section. Phase Ellipse Experiment x/time (s) ω/frequency(Hz) 300 1.50 500 1.55 700 1.60 900 1.50 1100 1.50 1300 1.50 1500 1.50 1700 1.45 1900 1.50 y/ voltage (V) 1.10 1.50 1.80 2.05 2.20 2.00 2.10 2.10 2.20 Φ/2-Phi/2 (degrees) 56.58 42.27 33.00 26.80 22.45 19.27 16.86 14.97 13.45 Φ-Phi (degrees) 113.16 84.54 66.00 53.60 44.90 38.54 33.72 29.94 26.90 Above is a table of the results obtained from the phase ellipse experiment, it displays the frequency of the oscillator, along with the time period (t) and the voltage (v), from this using the equation , and then by adjusting the equation to obtain the phase difference or phi, by: Researcher: Lewis Ellway Transient Experiment Demonstrator:
