Answers to Questions end of Part B ()
advertisement
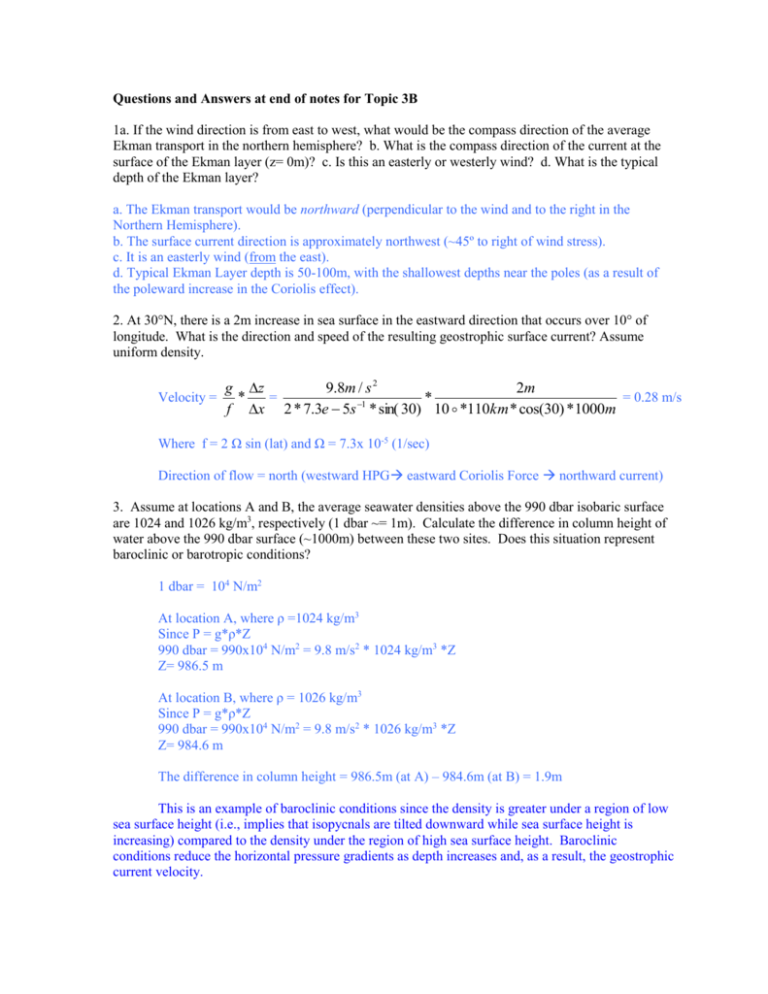
Questions and Answers at end of notes for Topic 3B 1a. If the wind direction is from east to west, what would be the compass direction of the average Ekman transport in the northern hemisphere? b. What is the compass direction of the current at the surface of the Ekman layer (z= 0m)? c. Is this an easterly or westerly wind? d. What is the typical depth of the Ekman layer? a. The Ekman transport would be northward (perpendicular to the wind and to the right in the Northern Hemisphere). b. The surface current direction is approximately northwest (~45º to right of wind stress). c. It is an easterly wind (from the east). d. Typical Ekman Layer depth is 50-100m, with the shallowest depths near the poles (as a result of the poleward increase in the Coriolis effect). 2. At 30°N, there is a 2m increase in sea surface in the eastward direction that occurs over 10° of longitude. What is the direction and speed of the resulting geostrophic surface current? Assume uniform density. g z 9.8m / s 2 2m Velocity = = = 0.28 m/s * * 1 f x 2 * 7.3e 5s * sin( 30) 10 *110km * cos(30) *1000m Where f = 2 Ω sin (lat) and Ω = 7.3x 10⁻⁵ (1/sec) Direction of flow = north (westward HPG eastward Coriolis Force northward current) 3. Assume at locations A and B, the average seawater densities above the 990 dbar isobaric surface are 1024 and 1026 kg/m3, respectively (1 dbar ~= 1m). Calculate the difference in column height of water above the 990 dbar surface (~1000m) between these two sites. Does this situation represent baroclinic or barotropic conditions? 1 dbar = 104 N/m2 At location A, where ρ =1024 kg/m3 Since P = g*ρ*Z 990 dbar = 990x104 N/m2 = 9.8 m/s2 * 1024 kg/m3 *Z Z= 986.5 m At location B, where ρ = 1026 kg/m3 Since P = g*ρ*Z 990 dbar = 990x104 N/m2 = 9.8 m/s2 * 1026 kg/m3 *Z Z= 984.6 m The difference in column height = 986.5m (at A) – 984.6m (at B) = 1.9m This is an example of baroclinic conditions since the density is greater under a region of low sea surface height (i.e., implies that isopycnals are tilted downward while sea surface height is increasing) compared to the density under the region of high sea surface height. Baroclinic conditions reduce the horizontal pressure gradients as depth increases and, as a result, the geostrophic current velocity. 4. In which regions of the ocean are the lowest sea surface height anomalies located? Why? (see Fig. 9) The SSH anomalies are lowest in the polar regions (near Greenland in the north and Antarctica in the south). Since the water column height above a chosen pressure surface (like the 1000 dbar surface) is inversely proportional to density [rearranging P= g*ρ*Z to yield Z= P/(g*ρ)], the column height will be lowest where the density is highest. Since the highest densities are found where the water is coldest, the lowest SSH are found in the polar regions. 5a. Draw a north-south (meridional) slice through the dynamic height field along 180°W in the Pacific (use Fig. 14). b. Indicate the direction of the zonal component of the resulting geostrophic currents at 40°N, 10°N, 30°S, and 60°S. c. Draw the slope (i.e., depth vs latitude) of the isopycnal layers underneath the sea surface a. The meridional trend in SSH (in dynamic meters) looks like the following (using Fig. 9) 60ºS = 70cm, 40ºS= 130cm, 20ºS= 190cm, 0º= 185cm, 20ºN= 195cm, 40ºN= 140cm, 60ºN= 120cm. b. The direction of zonal component of the geostrophic current are as follows: 40ºN = eastward (HPG is northward and Coriolis Force is southward) 10ºN = westward (HPG is southward and Coriolis Force is northward) 30ºS = eastward (HPG is southward and Coriolis Force is northward) 60ºS = eastward (HPG is southward and Coriolis Force is northward) c. The depth trend of the isopycnal layers is a mirror image of the sea surface height. So the isopycnals should be deepest where the SSH is the highest (~20ºS and 20ºN) and shallowest where the SSH is the lowest (60S, 0 and 50N). Thus the depths of the isopycnals generally get shallower as one proceeds poleward and equatorward from 20ºN and 20ºS. 6a. Calculate the geostrophic current speed at the surface of the Gulf Stream if the sea surface height increases by 1.4m over a distance 115 km at a latitude of 35°N? b. How does this compare to the geostrophic velocity calculations presented for the Florida Current in Fig. 22? a. Velocity = g z 9.8m / s 2 1.4m = = 1.4 m/s * * 5 f x 2 * 7.3x10 (1 / s) * sin( 35) 115km *1000m / km -where f = 2 Ω sin (lat) and Ω = 7.3x 10⁻⁵ (1/sec) b. This estimated velocity is within the 1.0 to 1.8 m/s range observed for the Gulf Stream (Fig. 23). 7a. What is the compass direction of the horizontal pressure gradient at 1000m based on the southward flowing current below the Gulf Stream (Z>1000m) seen in Fig. 22? b. Is this an example of a baroclinic or barotropic condition? c. How does the slope in isobar (ΔP/Δz) at 1000m compare to the slope of the isobar represented by the sea surface in the portion of the cross section between 100 and 160 kms shown in Fig. 22? 2 a. The HPG has shifted from pointing westward (towards the left) above 1000m to pointing eastward (towards the right) below 1000m. This is required to change the geostrophic flow from northward (above 1000m) to southward (below 1000m) as indicated in Fig. 22. b. This is an example of baroclinic conditions, where the slope of the isopycnals causes the speed of the geostrophic current to decrease with increasing depth. In the situation shown in Fig 22, the baroclinic adjustment has actually reversed the direction of the HPG at 1000m and thus the resulting direction of the geostrophic current. c. The slope of the isobar at 1000m must be lower than the slope at the sea surface because the speed of the geostrophic current is lower at 1000m (~0.05 cm/s) than at the surface speeds of 0.2 – 1.0 cm in the this region based on Fig. 22. 8a. How does the sea surface height of a Gulf Stream produced warm core ring compare to the sea surface height of its surrounding water? b. What would be the likely rotational direction (clockwise or counterclockwise) of a cold core ring? c. How would the photosynthesis rate inside a cold core ring likely compare to the photosynthesis rate outside? a. The SSH is higher inside the warm core ring than outside since the ring originated in the region of warmer SSTs in the subtropical gyre where SSH is high (right of 400km in Fig. 25). b. Clockwise because the higher SSH inside the ring, means that the HPG point outward and the Coriolis Force points inward, which requires clockwise current rotation in the Northern Hemisphere. c. In a cold core ring, the ring has originated from water north of the subtropical gyre where there is higher nutrient concentrations. Also since the SSH is lower inside the ring, there will be both inward and upward (upwelling) flow of water towards the center of the ring. The upwelling would decrease SSTs and increase nutrient concentrations. The higher nutrient concentrations inside the ring would likely yield higher photosynthesis rates. 3
