MEK_Section2_Stabili..
advertisement
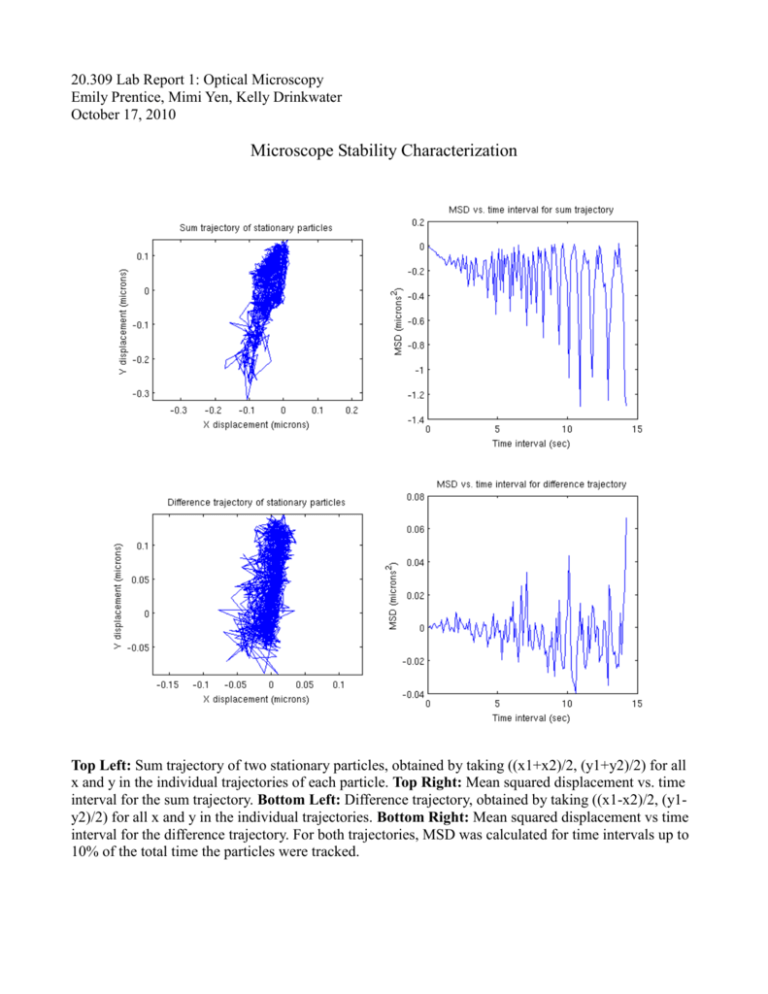
20.309 Lab Report 1: Optical Microscopy Emily Prentice, Mimi Yen, Kelly Drinkwater October 17, 2010 Microscope Stability Characterization Top Left: Sum trajectory of two stationary particles, obtained by taking ((x1+x2)/2, (y1+y2)/2) for all x and y in the individual trajectories of each particle. Top Right: Mean squared displacement vs. time interval for the sum trajectory. Bottom Left: Difference trajectory, obtained by taking ((x1-x2)/2, (y1y2)/2) for all x and y in the individual trajectories. Bottom Right: Mean squared displacement vs time interval for the difference trajectory. For both trajectories, MSD was calculated for time intervals up to 10% of the total time the particles were tracked. We tracked the motion of two stationary particles in a dry sample in order to characterize the stability of our microscope. These particles should move as little as possible. The sum trajectory highlights common mode vibration, i.e. motions that move all particle centroids identically (building vibration, jostles to the apparatus, etc.). The difference trajectory deemphasizes common-mode vibrations and focuses on noise effects that move the two particle centroids differently (camera shot noise, uneven illumination, dust, etc.). The top right graph in the figure shows a clear periodic common-mode vibration with a period of about 1 sec, likely a building vibration. For a time interval of 1 second, the mean squared displacement of the difference trajectory was less than 0.01µm2. For a time interval of 14 seconds (the longest interval calculated), the mean squared displacement was less than 0.08µm2. See section 4 for a description of the MSD calculation.
