Benha University
advertisement
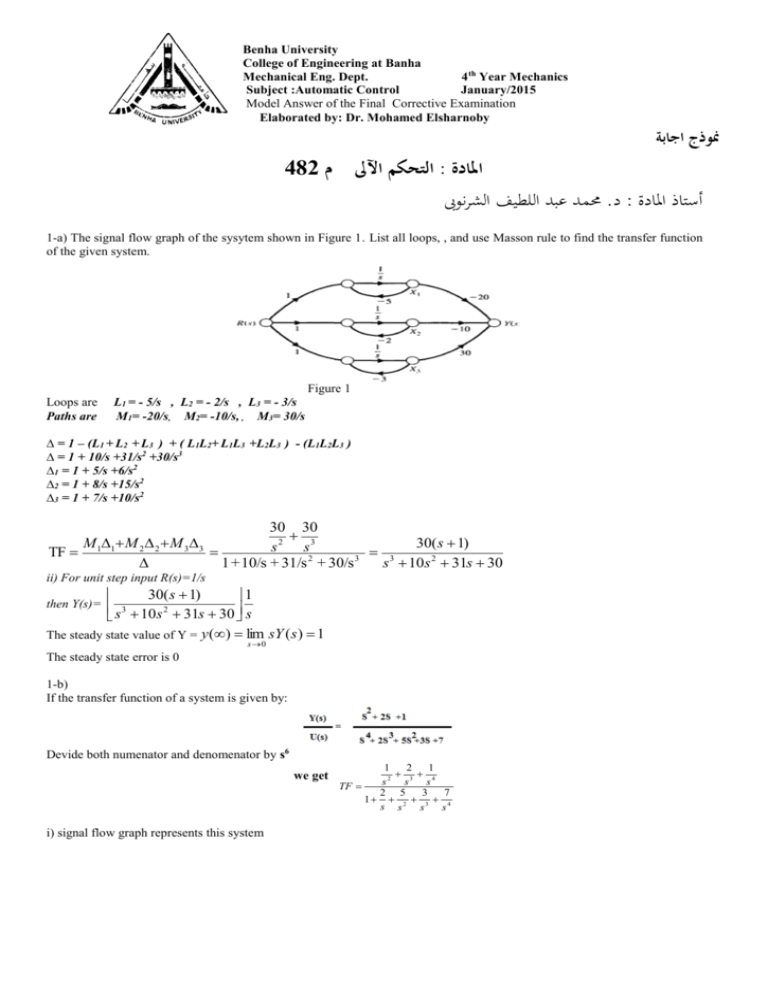
Benha University College of Engineering at Banha Mechanical Eng. Dept. 4 th Year Mechanics Subject :Automatic Control January/2015 Model Answer of the Final Corrective Examination Elaborated by: Dr. Mohamed Elsharnoby 482 التحكم اآلىل م: املادة منوذج اجابة حممد عبد اللطيف الشرنوىب. د: أستاذ املادة 1-a) The signal flow graph of the sysytem shown in Figure 1. List all loops, , and use Masson rule to find the transfer function of the given system. Figure 1 Loops are Paths are L1 = - 5/s , L2 = - 2/s , L3 = - 3/s M1= -20/s, M2= -10/s, , M3= 30/s ∆ = 1 – (L1 + L2 + L3 ) + ( L1L2+ L1L3 +L2L3 ) - (L1L2L3 ) ∆ = 1 + 10/s +31/s2 +30/s3 ∆1 = 1 + 5/s +6/s2 ∆2 = 1 + 8/s +15/s2 ∆3 = 1 + 7/s +10/s2 30 30 M M 2 2 M 3 3 30( s 1) s 2 s3 TF 1 1 3 2 3 1 + 10/s + 31/s + 30/s s 10s 2 31s 30 ii) For unit step input R(s)=1/s 30( s 1) 1 then Y(s)= 3 2 s 10s 31s 30 s The steady state value of Y = y () lim sY ( s ) 1 s 0 The steady state error is 0 1-b) If the transfer function of a system is given by: Devide both numenator and denomenator by s6 we get i) signal flow graph represents this system 1 2 1 3 4 2 s s s TF 2 5 3 7 1 2 3 4 s s s s Figure 2 Ii )Deduce the state space representation of the system., iii 2-a) 2-b) System (a) is type zero with kP =10 . kv =,0 ka=0, And the steady state errors for unit step, ramp, and acceleration inputs are respectively 1/11, ∞, ∞. System (b) is type one with kP =∞ . kv =,-2.5 ka=0, And the steady state errors for unit step, ramp, and acceleration inputs are respectively 0, -0.4, ∞. System (c) is type one with kP =∞ . kv =,0.4, ka=0, And the steady state errors for unit step, ramp, and acceleration inputs are respectively 0, 2.5, ∞. . 3-a) Consider a unity gain feedback control system. The plant transfer function is G(s)=1/(s^2+5s+6). Let the controller be of the form C(s) =K(s+z)/(s+p). Design the controller (ie choose K, z, p>0) so that the closed loop system has poles at Figure 3 K (s z) ( s p)( s 2 5s 6) K (s z) The characteristic equation is given by 1 0 which is reduced to ( s p)( s 2 5s 6) The open loop transfer function is given by C ( s)G ( s) (s+p)(s2+5s+6) + K(s+z) = 0 s 3 (5 p)s 2 (6 5 p K )s ( Kz 6 p) 0 The function is devisible by (s+1-i)(s+1-i) i.e devisible by s2+2s+2 i.e s 3 (5 p) s 2 (6 5 p K ) s ( Kz 6 p) = ( s 2 2s 2)( s a) 0 ( s 2 2s 2)( s a) 0 ( s 2 2s 2)( s a) s 3 (2 a) s 2 (2 2a) s 2a 0 Comparing the coefficients 5 p 2 a p 0 a 3 6 5(a 3) k 2 2a 11 3 kz 6 p 2a kz 6(a 3) 2a 11 z (11 3a) 18 4a a z 0 3 k 11 3a a Multiplying the coefficient of s2 by 2 and subtract the coefficient of s 4 3p k 2 k 3p 2 0 p 2 ,0 k 2 3 kz 2a 6 p 2 kz 0 p 22 z 1 3 2 ,0 k 2, z 1 3 3-b) For the control system shown in figure 3, sketch the root locus for the following three cases, indicate its direction, where K = 0, where K = ∞, and if they exist, find asymptotes. Figure 4 (i) Gc(s) = 1. , (ii) Gc(s) = s+1 (PD compensation), (iii)Gc(s) =1+1/s (PI compensation). For the appropriate choice of compensator, use root locus and Routh Hurwitz techniques to find the range of K for an under damped response . Because of the root locus typically approach the asymptotes as in (iii) , but may also lie on the asymptotes as in (i) and (ii) 4-a ) Bode Plots of a stable plant GP(s) are shown in Figure 4 below. Design a proportional controller Gc(s) = K, so that the steady state error for a unit step input is as small as possible, and the gain margin of the feedback system is greater or equal to 5 db. Figure 5 The proportional controller does not chsnge the phase but it does change then gain only We can shift the Bode plot representing the gain 6db and keep a gain margin of at least 5db as shown in figure below As ω tends to zero the gain approaches 10 10 20 log k p k p 3.16 Before the controller k p 100.2 1.585 The steady state error for unit input ess 1 as the system is zero type so 1 k p The steady state error is reduced from approximately 0.4 to approximately 0.25 4-b) Consider the following system where G(s) is a transfer function. Asymptotic Bode plots of G(s) is given in figure 5 below. For calculations, you may use these Asymptotic plots. ii) Find the gain margin of the system. iii) Find the phase margin of the system. iv) Find the transfer function of the system. . GOOD LUCK
