Paul West - Optical Spectroscopy
advertisement
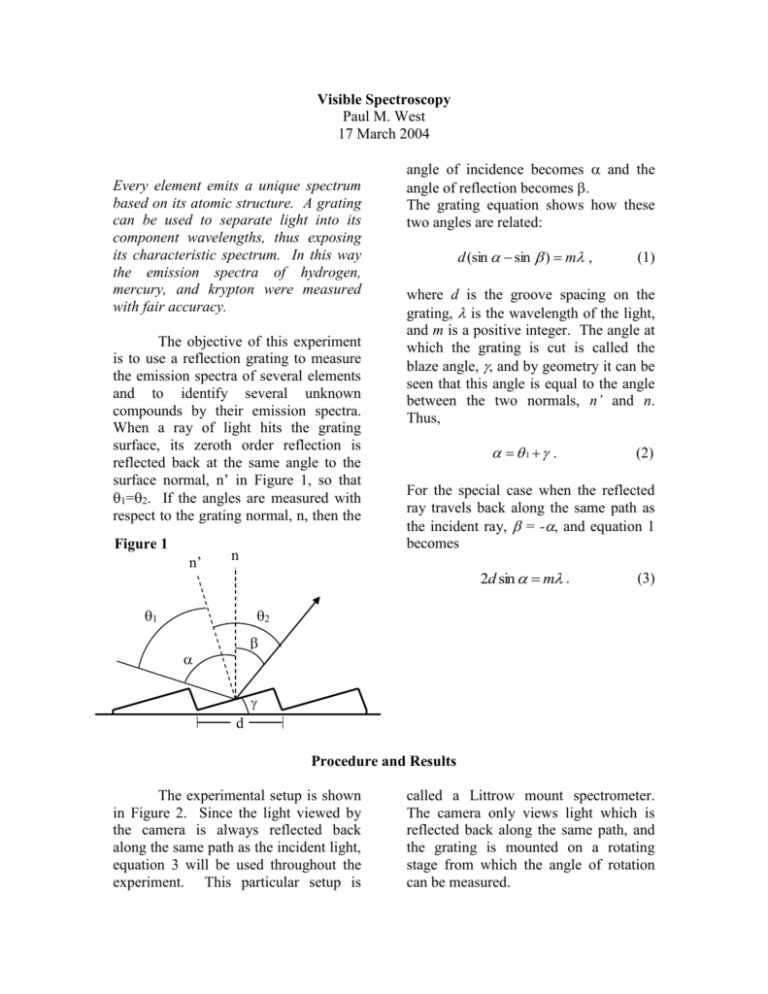
Visible Spectroscopy Paul M. West 17 March 2004 Every element emits a unique spectrum based on its atomic structure. A grating can be used to separate light into its component wavelengths, thus exposing its characteristic spectrum. In this way the emission spectra of hydrogen, mercury, and krypton were measured with fair accuracy. The objective of this experiment is to use a reflection grating to measure the emission spectra of several elements and to identify several unknown compounds by their emission spectra. When a ray of light hits the grating surface, its zeroth order reflection is reflected back at the same angle to the surface normal, n’ in Figure 1, so that 1=2. If the angles are measured with respect to the grating normal, n, then the Figure 1 n’ n angle of incidence becomes and the angle of reflection becomes . The grating equation shows how these two angles are related: d (sin sin ) m , where d is the groove spacing on the grating, is the wavelength of the light, and m is a positive integer. The angle at which the grating is cut is called the blaze angle, , and by geometry it can be seen that this angle is equal to the angle between the two normals, n’ and n. Thus, . (2) For the special case when the reflected ray travels back along the same path as the incident ray, = -, and equation 1 becomes 2d sin m . 1 (1) (3) 2 d Procedure and Results The experimental setup is shown in Figure 2. Since the light viewed by the camera is always reflected back along the same path as the incident light, equation 3 will be used throughout the experiment. This particular setup is called a Littrow mount spectrometer. The camera only views light which is reflected back along the same path, and the grating is mounted on a rotating stage from which the angle of rotation can be measured. 2d sin( 1 ) m . Figure 2 Camera Laser Grating Lens Adjustable Slit (4) By measuring 1 for both m=1 and m=2, and using the known wavelength of the He-Ne laser, d and can both be determined. In this way d is found to be 833.794 0.997 nm, and is found to be 0.109 0.068. The uncertainties for these measurements come from the uncertainty of the angles measured on the rotating stage, which have an uncertainty of 0.0417. Calibrating the Rotating Stage Measuring emission spectra The rotating stage must first be calibrated using a helium-neon laser as the light source the. The lens is removed and the mirrors are adjusted so that the laser shines directly on the slit and hence on the grating. Because 1=2 for the zeroth order reflection, the angled surfaces of the grating are known to be perpendicular to the incident light when the zeroth order maximum is reflected straight back to the slit. The stage is adjusted so that this is the case and then the angle measured on the stage is set to zero at this point. This guarantees that the angle measurement read from the stage is 1, the angle of incidence measured with respect to n’. To determine the distance d between the grooves on the grating requires equations 2 and 3 as well as the the angles of incidence at which the m=1 and m=2 reflections come straight back to the slit. Combining equations 2 and 3 gives The emission spectra are measured using the setup in Figure 2, using the lens to collimate the light as it heads toward the grating and to focus the light as it travels back to the camera. Instead of the laser, a discharge lamp is placed behind the slit and all other light sources are turned off or blocked so as to avoid noise in the measurements. The zeroth order reflection is known to be approximately at 0 and is measured exactly so that all the other angles may be adjusted if need be. A piece of tape placed across the computer screen with a mark on it ensures that all lines are measured at the same spot in the camera viewing screen. The angle of each emission line is measured by turning the stage in the same direction as when d was determined. This procedure was carried out for three known lamps, hydrogen, mercury, and krypton. The results are shown in Figures 3, 4, and 5. Figure 3 Measured hydrogen spectrum Figure 4 Measured mercury spectrum Figure 5 Measured krypton spectrum Each figure shows the measured spectrum with error bars to indicate uncertainty, and the true known spectrum underneath. In the true spectra of mercury and krypton, some of the lines are grayed out in order to more clearly show which known lines the measured lines correlate to. The errors for the measured wavelengths were found using standard propagation of error techniques and a typical error for the wavelength measurement is 2.25 nm. Two unknown lamps were examined, however no acceptable matches were found. Discussion Almost all of the spectral lines come within uncertainties of the true spectral lines, however there seems to be a slight systematic shift to the left in all the measured spectra. A good explanation for this shift is that the grating is mounted such that it is slightly rotated about its normal (the groves are not straight up and down). The evidence for this theory lies in the fact that the height of the reflected He-Ne laser relative to the incident ray, changes as the grating stage is rotated. If the grooves were straight up and down, this would not happen. This slight rotation of the grating about its normal would cause the measured angle to be slightly smaller than the true angle of incidence, which would yield a slightly smaller wavelength. This is consistent with the results shown above. Conclusion The objective of this lab was to measure the emission spectra of several discharge lamps and to identify several unknown discharge lamps from their emission spectra. The emission spectra of three known discharge lamps, hydrogen, mercury, and krypton, were measured successfully. All the true wavelengths fell within the uncertainties of the measured wavelengths, except for one green line on mercury and one green line on krypton. The results would likely be improved by taking into account the tilt of the grating, which appears to have shifted all the measured wavelengths down a small amount. Measurements were not taken to determine the magnitude of this effect however, taking this into account would indeed shift the wavelengths in the correct direction. The spectra measured from the unknown discharge lamps were not able to be identified successfully. Both of the unknown spectra had relatively few lines. This is probably due the lamps being too dim. Brighter lamps and a more sensitive camera would allow more emission lines to be visible. References Koppen, J. Spectra of Gas Discharges. http://astro.u-strasbg.fr/~koppen/discharge/, February 13, 2003.
