homework 5 (power)
advertisement
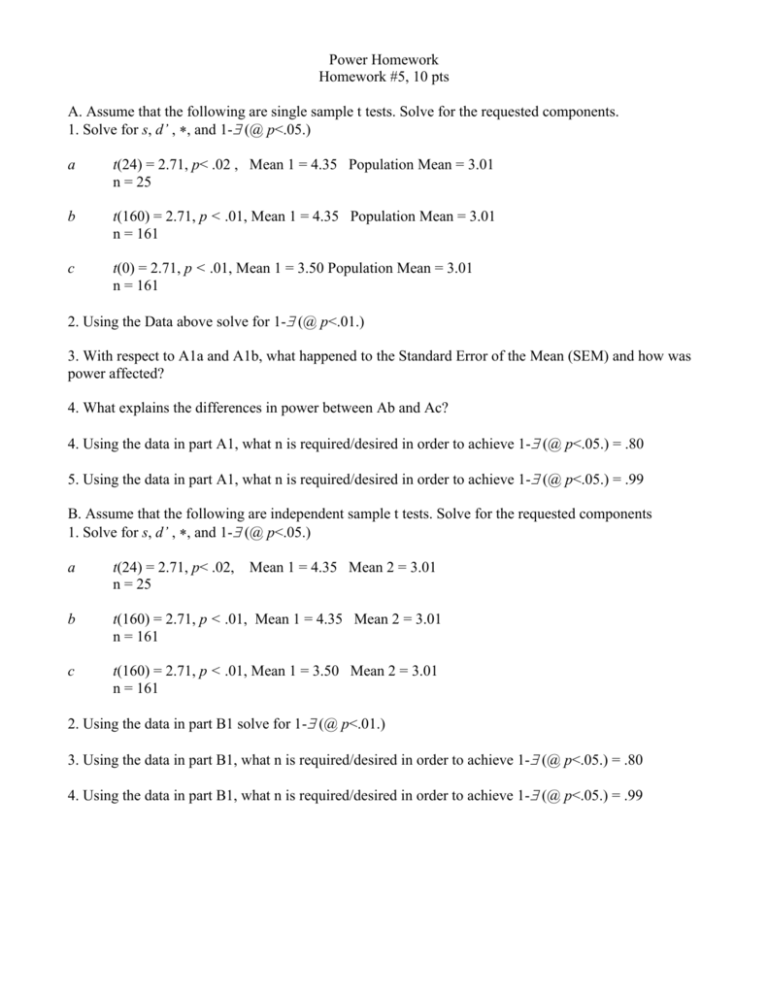
Power Homework Homework #5, 10 pts A. Assume that the following are single sample t tests. Solve for the requested components. 1. Solve for s, d’ , , and 1- (@ p<.05.) a t(24) = 2.71, p< .02 , Mean 1 = 4.35 Population Mean = 3.01 n = 25 b t(160) = 2.71, p < .01, Mean 1 = 4.35 Population Mean = 3.01 n = 161 c t(0) = 2.71, p < .01, Mean 1 = 3.50 Population Mean = 3.01 n = 161 2. Using the Data above solve for 1- (@ p<.01.) 3. With respect to A1a and A1b, what happened to the Standard Error of the Mean (SEM) and how was power affected? 4. What explains the differences in power between Ab and Ac? 4. Using the data in part A1, what n is required/desired in order to achieve 1- (@ p<.05.) = .80 5. Using the data in part A1, what n is required/desired in order to achieve 1- (@ p<.05.) = .99 B. Assume that the following are independent sample t tests. Solve for the requested components 1. Solve for s, d’ , , and 1- (@ p<.05.) a t(24) = 2.71, p< .02, n = 25 Mean 1 = 4.35 Mean 2 = 3.01 b t(160) = 2.71, p < .01, Mean 1 = 4.35 Mean 2 = 3.01 n = 161 c t(160) = 2.71, p < .01, Mean 1 = 3.50 Mean 2 = 3.01 n = 161 2. Using the data in part B1 solve for 1- (@ p<.01.) 3. Using the data in part B1, what n is required/desired in order to achieve 1- (@ p<.05.) = .80 4. Using the data in part B1, what n is required/desired in order to achieve 1- (@ p<.05.) = .99 C. For the following correlations solve for the requested components. 1. Solve for r2, d’ , , and 1- (@ p<.05.) a. r(28) = .20, p > 05, ns n = 30 b. r(100) = .20, p < .05. n = 102 c. r(60) = .33, p < .01. n = 62 2. With respect to 1a and 1b, in which instance is the percent overlap between the distribution of Ho and H1 that is attributable to sampling error the greatest? 3. Using the data in part C1, what n is required/desired in order to achieve 1- (@ p<.05.) = .80 4. Using the data in part C1, what n is required/desired in order to achieve 1- (@ p<.05.) = .99 5. Find the appropriate 2, d’ , , and 1- (@ p<.02.) for the following 2X3 chi square. 2(df =2, n = 115) = 5.99, p<.05. D. For the following F Statistics, solve for the requested components. 1. Solve for R2, , and 1- (@ p<.05.). (For problem a, assume that you have two groups. For problem b & c assume that you have more than 2 groups). a. F(1, 173) = 3.13, p > .05, ns. n = 175 b. F(2, 173) = 3.13, p < .05. n = 176 c. F(4, 73) = 3.13, p < .05. 2. Why is the estimate of effect size in 1c, greater than in 1b? 3. Using the data in part C1 solve for 1- (@ p<.01.). 4. Using the data in part C1, what n is required/desired in order to achieve 1- (@ p<.01.) = .99

