doc
advertisement

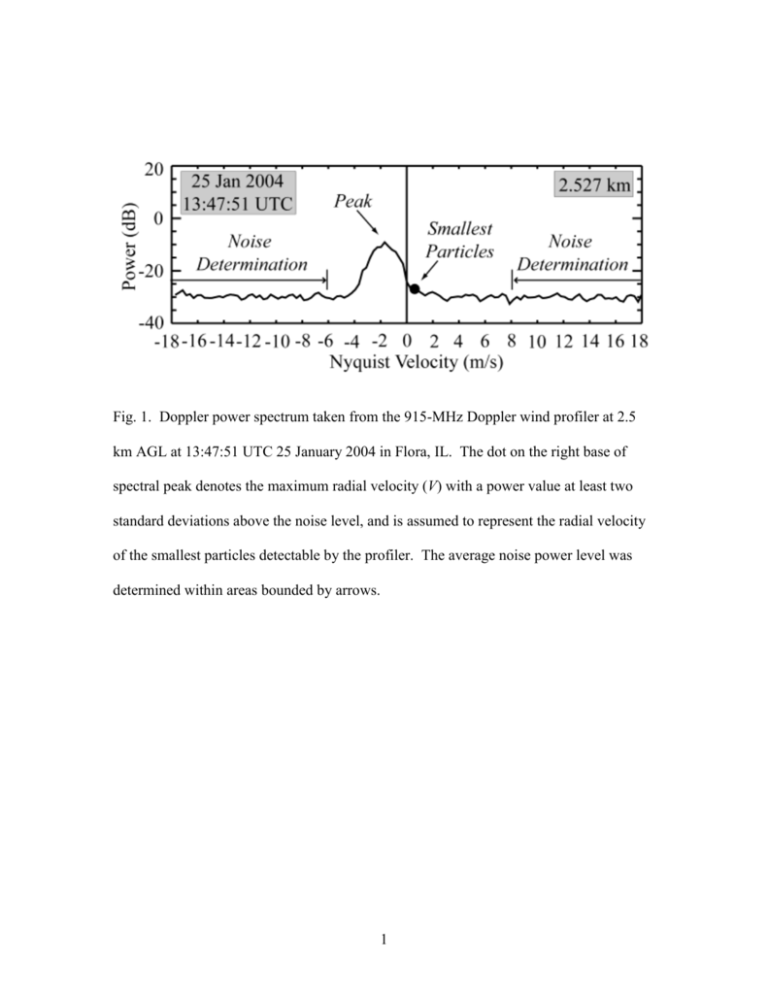
Fig. 1. Doppler power spectrum taken from the 915-MHz Doppler wind profiler at 2.5 km AGL at 13:47:51 UTC 25 January 2004 in Flora, IL. The dot on the right base of spectral peak denotes the maximum radial velocity (V) with a power value at least two standard deviations above the noise level, and is assumed to represent the radial velocity of the smallest particles detectable by the profiler. The average noise power level was determined within areas bounded by arrows. 1 Fig. 2. Snow particle spectra (n(D) in units of cm-4) at four flight altitudes measured in a winter storm over Champaign, IL on 26 November 1975 [adapted from Passarelli (1978)]. 2 Fig. 3. Terminal velocity VT (thin lines at top of diagram) and reflectivity-weighted contribution of particles to terminal velocity Vt (bold lines) as a function of diameter for each particle spectra at the four altitudes in Passarelli (1978). The diameter at each altitude with the smallest, non-negligible contribution to the power returned is in bold and circled in the bottom left of the diagram. The corresponding terminal velocity at each altitude is circled and labeled in the top left of the diagram. 3 Fig. 4. (a) Schematic diagram of geometry of vertical beam of profiler with beam width of 9° and half-power points at edges of beam (4.5° off zenith). Variations in particle terminal fall velocity (VT), mean horizontal wind ( u ) due to the finite beam width, vertical wind shear within a range gate, and variations in vertical air motion due to turbulence contribute to broadening of the power spectrum. (b) Geometry of the profiler’s vertical beam illustrating the contribution of the incoming (left) and outgoing (right) mean horizontal wind ( u ), vertical air motion (w), and terminal fall velocity (VT) to the radial velocity. 4 Fig. 5. Eta analysis of potential temperature (heavy contours, 2-K intervals) and relative humidity (shaded, 10-percent intervals greater than 70 percent) at 700 hPa for C1: (a) 1200 UTC 25 January 2004 and (b) 0000 UTC 26 January 2004; C2: (c) 0000 UTC 15 February 2004 and (d) 1200 UTC 15 February 2004; and C3: (e) 0000 UTC 26 February 2004 and (f) 1200 UTC 26 February 2004. The relative humidity scale is in the top left panel. On each panel, the star depicts the profiler location and the dots denote sounding locations. 5 Fig. 6. Same as Figure 5, except for equivalent potential temperature. 6 Fig. 7. Composite base reflectivity for (a) 1500 UTC 25 January 2004, (b) 0800 UTC 15 February 2004, and (c) 2100 UTC 25 February 2004. On each panel, the star depicts the profiler location. 7 Fig. 8. Time series of 915-MHz Doppler wind profiler signal-to-noise ratio (left panels) and radial velocity (right panels) above ground level for C1: (a) and (b) 25 January 2004 at Flora, IL; C2: (c) and (d) 15 February 2004 at Huntsville, AL; and C3: (e) and (f) 2526 February 2004 at Huntsville, AL. Key is shown in upper center of figure. Negative values of radial velocity indicate motion toward profiler (downward). Lettered brackets correspond to the bands analyzed within each cyclone. 8 Fig. 9. Thermodynamic diagrams depicting soundings for C1: (a) 1800 UTC 25 January 2004 taken from Lincoln, IL (KILX); C2: (b) 0000 UTC 15 February 2004 taken from Birmingham, AL (KBMX) and (c) 1200 UTC 15 February 2004 taken from Nashville, TN (KBNA); and C3: (d) 0000 UTC 26 February 2004 and (e) 1200 UTC 26 February 2004, both taken from Birmingham, AL. 9 Fig. 10. Derived vertical motion, w, (top panels) and signal-to-noise ratio (bottom panels) for three bands in C1 at (a) and (d) 1340 – 1400 UTC, (b) and (e) 1510 – 1550 UTC, and (c) and (f) 1800 – 1840 UTC on 25 January 2004. Heavy boxes in bottom panels show the areas of each band where w was determined. 10 Fig. 11. Same as Fig. 4.1 except for three bands in C2 at (a) and (d) 0550 – 0640 UTC, (b) and (e) 0840 – 0910 UTC, and (c) and (f) 1045 – 1135 UTC on 15 February 2004. 11 Fig. 12. Same as Fig. 4.1 except for three bands in C3 at (a) and (d) 2055 – 2135 UTC 25 February 2004, (b) and (e) 0050 – 0135 UTC 26 February 2004, and (c) and (f) 0550 – 0635 UTC 26 February 2004. 12 Fig. 13. Scatter plots of signal-to-noise ratio versus derived vertical motion, w, for (a) Band A in C1, (b) Band B in C1, (c) Band C in C1, (d) all bands in C1, (e) Band D in C2, (f) Band E in C2, (g) Band F in C2, (h) all bands in C2, (i) Band G in C3, (j) Band H in C3, (k) Band I in C3, and (l) all bands in C3. Solid line is linear regression line with the correlation coefficient, r, in the lower corner of each figure. 13 Fig. 14. Cumulative frequency diagrams showing the percent of derived w values less than w (center bold line in each panel) and the uncertainty in w (two thin lines in each panel) for (a) Band A in C1, (b) Band B in C1, (c) Band C in C1, (d) all bands in C1, (e) Band D in C2, (f) Band E in C2, (g) Band F in C2, (h) all bands in C2, (i) Band G in C3, (j) Band H in C3, (k) Band I in C3, and (l) all bands in C3. Thick, vertical dashed line in each panel denotes the location of w = 0. 14 Fig. 15. Scatter plot of signal-to-noise ratio versus derived vertical motion, w, for all cyclones combined. Solid line is linear regression. Correlation coefficient, r, is shown in the lower right corner. 15 Fig. 16. Cumulative frequency diagram showing the percent of derived w values less than w (center bold line in each panel) and the uncertainty in w (two thin lines in each panel) for all cyclones combined. Thick, vertical dashed line in each panel denotes the location of w = 0. 16


