Graphing instructions
advertisement
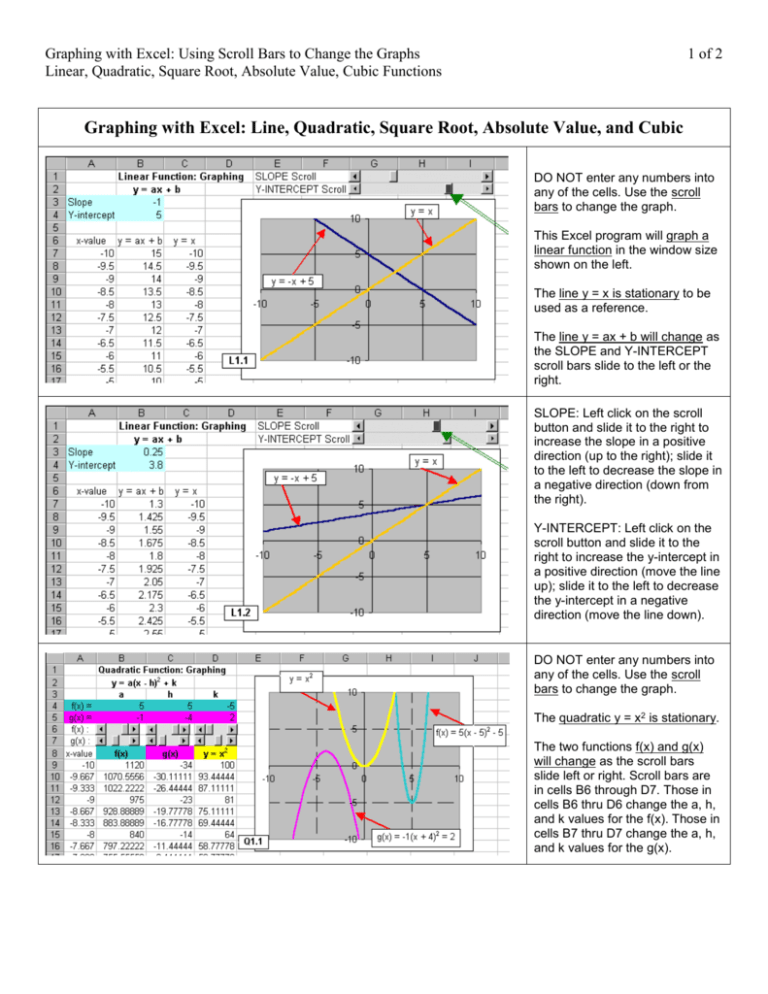
Graphing with Excel: Using Scroll Bars to Change the Graphs Linear, Quadratic, Square Root, Absolute Value, Cubic Functions 1 of 2 Graphing with Excel: Line, Quadratic, Square Root, Absolute Value, and Cubic DO NOT enter any numbers into any of the cells. Use the scroll bars to change the graph. This Excel program will graph a linear function in the window size shown on the left. The line y = x is stationary to be used as a reference. The line y = ax + b will change as the SLOPE and Y-INTERCEPT scroll bars slide to the left or the right. SLOPE: Left click on the scroll button and slide it to the right to increase the slope in a positive direction (up to the right); slide it to the left to decrease the slope in a negative direction (down from the right). Y-INTERCEPT: Left click on the scroll button and slide it to the right to increase the y-intercept in a positive direction (move the line up); slide it to the left to decrease the y-intercept in a negative direction (move the line down). DO NOT enter any numbers into any of the cells. Use the scroll bars to change the graph. The quadratic y = x2 is stationary. The two functions f(x) and g(x) will change as the scroll bars slide left or right. Scroll bars are in cells B6 through D7. Those in cells B6 thru D6 change the a, h, and k values for the f(x). Those in cells B7 thru D7 change the a, h, and k values for the g(x). Graphing with Excel: Using Scroll Bars to Change the Graphs Linear, Quadratic, Square Root, Absolute Value, Cubic Functions 2 of 2 DO NOT enter any numbers into any of the cells. Use the scroll bars to change the graph. The square root function y x is stationary. The two functions f(x) and g(x) will change as the scroll bars slide left or right. Scroll bars are in cells B6 through D7. Those in cells B6 thru D6 change the a, h, and k values for the f(x). Those in cells B7 thru D7 change the a, h, and k values for the g(x). DO NOT enter any numbers into any of the cells. Use the scroll bars to change the graph. The absolute value function y = |x| is stationary. The two functions f(x) and g(x) will change as the scroll bars slide left or right. Scroll bars are in cells B6 through D7. Those in cells B6 thru D6 change the a, h, and k values for the f(x). Those in cells B7 thru D7 change the a, h, and k values for the g(x). DO NOT enter any numbers into any of the cells. Use the scroll bars to change the graph. The cubic function y = x3 is stationary. The two functions f(x) and g(x) will change as the scroll bars slide left or right. Scroll bars are in cells B6 through D7. Those in cells B6 thru D6 change the a, h, and k values for the f(x). Those in cells B7 thru D7 change the a, h, and k values for the g(x).
