A. Confidence Interval for a Population Proportion
advertisement
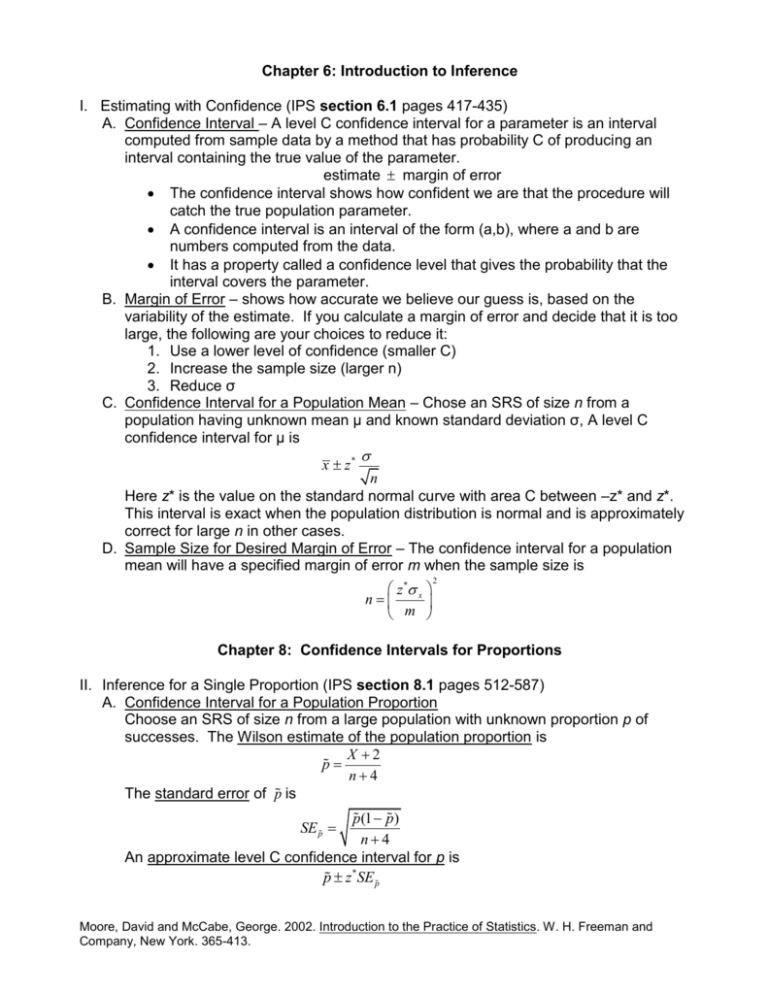
Chapter 6: Introduction to Inference I. Estimating with Confidence (IPS section 6.1 pages 417-435) A. Confidence Interval – A level C confidence interval for a parameter is an interval computed from sample data by a method that has probability C of producing an interval containing the true value of the parameter. estimate margin of error The confidence interval shows how confident we are that the procedure will catch the true population parameter. A confidence interval is an interval of the form (a,b), where a and b are numbers computed from the data. It has a property called a confidence level that gives the probability that the interval covers the parameter. B. Margin of Error – shows how accurate we believe our guess is, based on the variability of the estimate. If you calculate a margin of error and decide that it is too large, the following are your choices to reduce it: 1. Use a lower level of confidence (smaller C) 2. Increase the sample size (larger n) 3. Reduce σ C. Confidence Interval for a Population Mean – Chose an SRS of size n from a population having unknown mean μ and known standard deviation σ, A level C confidence interval for μ is x z* n Here z* is the value on the standard normal curve with area C between –z* and z*. This interval is exact when the population distribution is normal and is approximately correct for large n in other cases. D. Sample Size for Desired Margin of Error – The confidence interval for a population mean will have a specified margin of error m when the sample size is z * x n m 2 Chapter 8: Confidence Intervals for Proportions II. Inference for a Single Proportion (IPS section 8.1 pages 512-587) A. Confidence Interval for a Population Proportion Choose an SRS of size n from a large population with unknown proportion p of successes. The Wilson estimate of the population proportion is X 2 p n4 The standard error of p is p(1 p) n4 An approximate level C confidence interval for p is p z*SE p SE p Moore, David and McCabe, George. 2002. Introduction to the Practice of Statistics. W. H. Freeman and Company, New York. 365-413. where z* is the value for the standard normal density curve with area C between –z* and z*. The margin of error is m z*SE p Use this interval when the sample size is at least n = 5 and the confidence level is 90%, 95%, or 99%. B. Large-Sample Significance Test for a Population Proportion Draw an SRS of size n from a large population with unknown proportion p of successes. To test the hypothesis Ho: p = po, compute the z statistic p po z po (1 po ) n In terms of a standard normal random variable Z, the approximate P-value for a test of Ho against Ha: > 0 is P(Z z) Ha: < 0 is P(Z z) Ha: 0 is 2P(Z |z|) C. Sample Size for Desired Margin of Error The level C confidence interval for a proportion p will have a margin of error approximately equal to a specified value m when the sample size satisfies z* * n 4 (1 * ) m Here z* is the critical value for confidence C, and p* is a guessed value for the proportion of successes in the future sample. The margin of error will be less than or equal to m if p* is chosen to be 0.5. The sample size required is then given by z* n4 2m 2 Moore, David and McCabe, George. 2002. Introduction to the Practice of Statistics. W. H. Freeman and Company, New York. 365-413.


