FRAP model of nuclear-cytoplasm experiment
advertisement
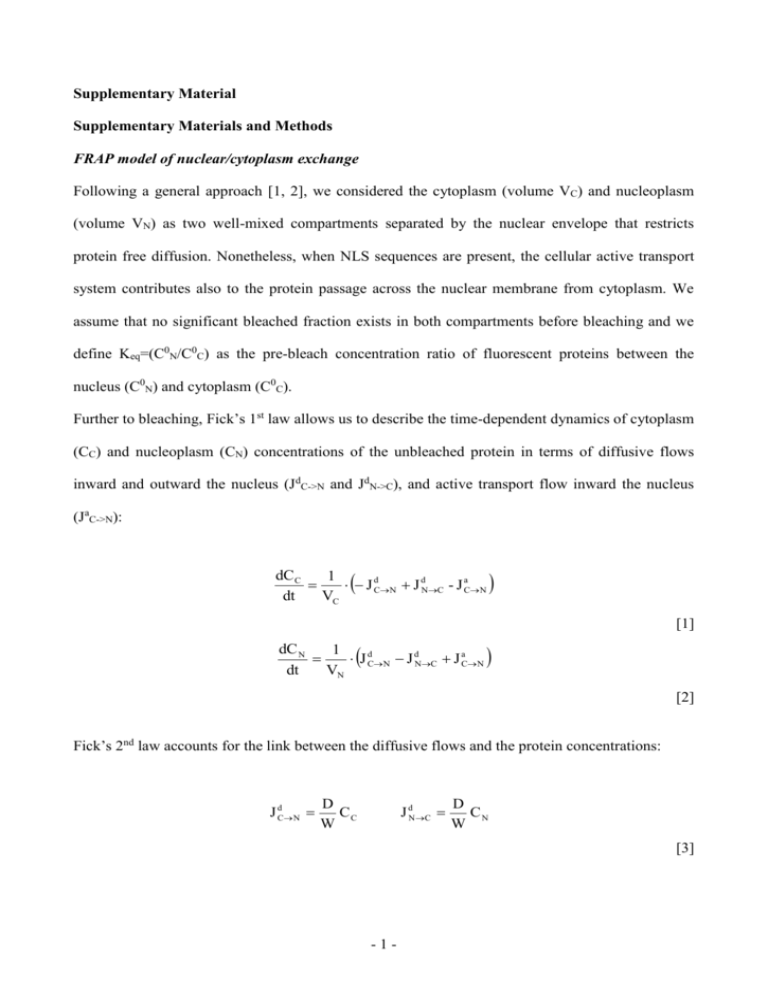
Supplementary Material Supplementary Materials and Methods FRAP model of nuclear/cytoplasm exchange Following a general approach [1, 2], we considered the cytoplasm (volume VC) and nucleoplasm (volume VN) as two well-mixed compartments separated by the nuclear envelope that restricts protein free diffusion. Nonetheless, when NLS sequences are present, the cellular active transport system contributes also to the protein passage across the nuclear membrane from cytoplasm. We assume that no significant bleached fraction exists in both compartments before bleaching and we define Keq=(C0N/C0C) as the pre-bleach concentration ratio of fluorescent proteins between the nucleus (C0N) and cytoplasm (C0C). Further to bleaching, Fick’s 1st law allows us to describe the time-dependent dynamics of cytoplasm (CC) and nucleoplasm (CN) concentrations of the unbleached protein in terms of diffusive flows inward and outward the nucleus (JdC->N and JdN->C), and active transport flow inward the nucleus (JaC->N): dC C 1 J dCN J dNC - J aCN dt VC [1] dC N 1 J dCN J dNC J aCN dt VN [2] Fick’s 2nd law accounts for the link between the diffusive flows and the protein concentrations: J dC N D CC W J dN C D CN W [3] -1- where D is the diffusion coefficient of the molecule and W is the diffusive resistivity of the nuclear membrane [1]. The active transport flux is known to depend on several parameters, for example the concentration and composition of the Importin transport system, and the RanGTP gradient across the membrane [3]. A detailed kinetic model of active transport is reported by Gorlich et al [2]. Nonetheless, in the time-scale of a typical FRAP experiment, no significant changes of these parameters are likely to occur, as they are related principally to the cell metabolic state. Accordingly, we shall assume that the active transport flux of the target protein is constant throughout all the FRAP experiment, and we denote it with v0. The active transport flux of the unbleached protein molecules (the only ones that matter for FRAP), however, cannot be constant during the measurement, as it is proportional to the unbleached fraction present in the cytoplasm at each time: J 0C N v 0 CC C0 [4] The mathematical analysis of the differential system represented by Eqs. [1]-[4] yields analytical monoexponential solutions for both compartments: C C C C C 0C C C exp t / τ [5] C N C N VC 0 C C C C exp t / τ VN [6] where C C and C N are the concentrations of unbleached proteins in the two compartments after infinite recovery time. Furthermore, the relevant transport parameters of transport across the nuclear envelope are expressed by: -2- K eq D v0 W CC D W [7] VN D VN τ W VC D v 0 W CC [8] Assuming linear proportionality between fluorescence and concentration, Equations [5] and [6] would describe the post-bleaching recovery curves scaled for the fluorophore brightness Supplementary References S1. S2. S3. Wei, X., Henke, V.G., Strubing, C., Brown, E.B., and Clapham, D.E. (2003). Real-time imaging of nuclear permeation by EGFP in single intact cells. Biophys J 84: 1317-1327. Ribbeck, K., and Gorlich, D. (2001). Kinetic analysis of translocation through nuclear pore complexes. Embo J 20: 1320-1330. Izaurralde, E., Kutay, U., von Kobbe, C., Mattaj, I.W., and Gorlich, D. (1997). The asymmetric distribution of the constituents of the Ran system is essential for transport into and out of the nucleus. Embo J 16: 6535-6547. -3- Supplementary Figure Captions Fig. S1: Schematic representation of the dynamic model proposed in this study (A) Reversible passive diffusion across NPC (black arrows). This process leads to a uniform distribution of the diffusing molecule between compartments (Keq=1). Passive flux through the NPC is characterized by the pure dynamic parameter D/W where D is the diffusion coefficient within cytoplasm and W is the nuclear pore resistivity. (B) Active nuclear import (red arrow). When NLS properties come into play, nucleus is enriched of target proteins (Keq>1) by carrier-mediated transport. Active flux is characterized by the composed parameter v0/CC0 that depends on both NLS-induced nuclear import rate (v0) and the expression level of the active import substrate in the cytoplasm (CC0). Concomitant passive nucleus-tocytoplasm is allowed (black arrow). Fig. S2: cytoplasmic FRAP measurements (A) Fluorescence recovery after cytoplasm photobleaching as GFP diffuses from nucleus to cytoplasm. Cytoplasmic fluorescence (pre-bleach panel) was photobleached by performing repeated scans of the whole cytoplasmic region with laser at full power. Recovery was recorded by timelapse imaging at low laser power: selected images are shown with the corresponding time of aquisition. Scale bar: 10 m. (B) As in (A), fluorescence recovery after cytoplasm photobleaching as Tat11-GFP diffuses from nucleus to cytoplasm. Scale bar: 10 m. (C) Time course of cytoplasmic fluorescence recovery (full circles) for the cell shown in (A) and (B). Nucleoplasmic fluorescence concomitantly decreases as GFP and Tat11-GFP (empty green and red circles, respectively) diffuse from nucleus to cytoplasm. This symmetric process shows the same kinetics yielding a time constant (τ) around 55 s for GFP and 213 s for Tat11-GFP in the -4- analysed cell (single-exponential fits are represented by continuous black lines). All FRAP curves are normalized by pre-bleach values: the asymptotic value of 1 reveals that no immobile fraction of molecules is present in the bleached compartment (the cytoplasm). Fig. S3: FRAP analysis of Tat11-GFP binding to nucleolus (A) This set of FRAP measurements was carried out by setting the double scanning mode and the image format to 256x256 pixels. Nucleolar fluorescence (white arrow) was photobleached by performing repeated scans of the whole nucleolar area with laser at full power. Recovery was recorded by imaging at 0.4 s intervals with low laser power: selected images of the whole cell are reported with the corresponding time of aquisition. Scale bar: 10 m. (B) Nucleolar fluorescence photobleaching and subsequent recovery (full red circles). Vertical dashed line indicates the end of the bleaching step. Single-exponential fitting yields a time constant of 1.3 ± 0.1 s, revealing that communication between nucleoplasm and nucleolus takes place in a much shorter time-scale than shuttling across NE. Nucleolar fluorescence returns to pre-bleach value (horizontal dashed line), indicating that Tat11-GFP is not immobilized within this sub-nuclear compartment. Empty circles represent nucleoplasmic fluorescence. Furthermore, the loss of nucleoplasmic fluorescence to the nucleolar accumulation was very low, suggesting that Tat11-GFP nucleolar enrichment may occur at surface level. -5-
