here... - primer-e
advertisement

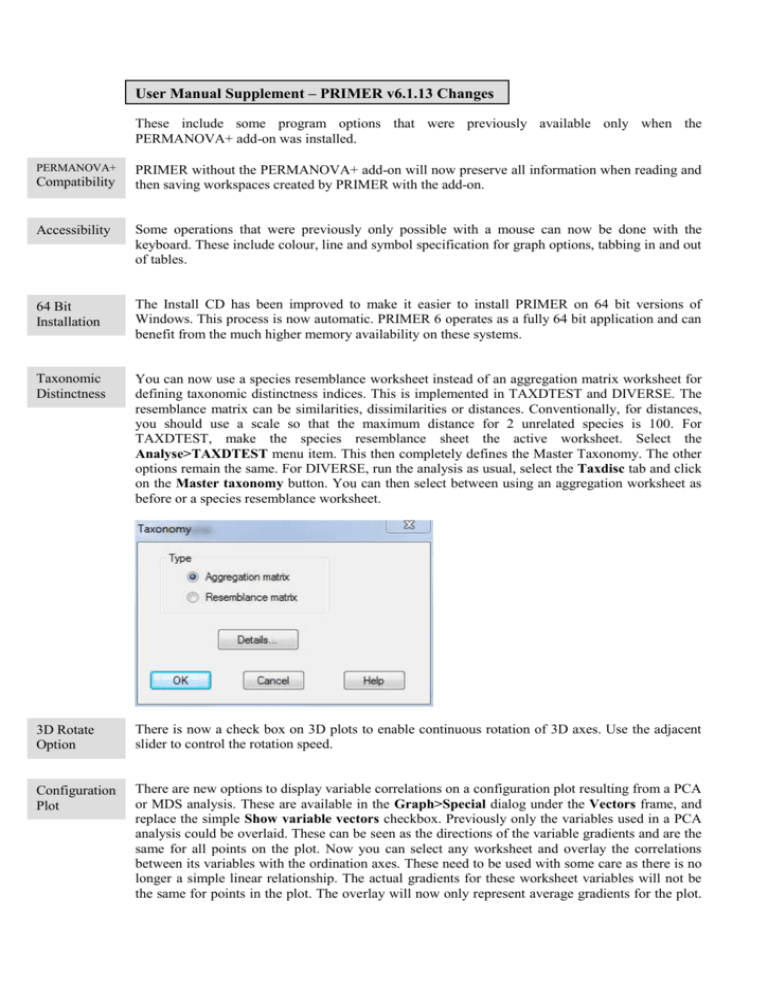
User Manual Supplement – PRIMER v6.1.13 Changes These include some program options that were previously available only when the PERMANOVA+ add-on was installed. PERMANOVA+ Compatibility PRIMER without the PERMANOVA+ add-on will now preserve all information when reading and then saving workspaces created by PRIMER with the add-on. Accessibility Some operations that were previously only possible with a mouse can now be done with the keyboard. These include colour, line and symbol specification for graph options, tabbing in and out of tables. 64 Bit Installation The Install CD has been improved to make it easier to install PRIMER on 64 bit versions of Windows. This process is now automatic. PRIMER 6 operates as a fully 64 bit application and can benefit from the much higher memory availability on these systems. Taxonomic Distinctness You can now use a species resemblance worksheet instead of an aggregation matrix worksheet for defining taxonomic distinctness indices. This is implemented in TAXDTEST and DIVERSE. The resemblance matrix can be similarities, dissimilarities or distances. Conventionally, for distances, you should use a scale so that the maximum distance for 2 unrelated species is 100. For TAXDTEST, make the species resemblance sheet the active worksheet. Select the Analyse>TAXDTEST menu item. This then completely defines the Master Taxonomy. The other options remain the same. For DIVERSE, run the analysis as usual, select the Taxdisc tab and click on the Master taxonomy button. You can then select between using an aggregation worksheet as before or a species resemblance worksheet. 3D Rotate Option There is now a check box on 3D plots to enable continuous rotation of 3D axes. Use the adjacent slider to control the rotation speed. Configuration Plot There are new options to display variable correlations on a configuration plot resulting from a PCA or MDS analysis. These are available in the Graph>Special dialog under the Vectors frame, and replace the simple Show variable vectors checkbox. Previously only the variables used in a PCA analysis could be overlaid. These can be seen as the directions of the variable gradients and are the same for all points on the plot. Now you can select any worksheet and overlay the correlations between its variables with the ordination axes. These need to be used with some care as there is no longer a simple linear relationship. The actual gradients for these worksheet variables will not be the same for points in the plot. The overlay will now only represent average gradients for the plot. The Base variables option is equivalent to the old Show variable vectors checkbox. With the Worksheet variables option, you can choose a correlation type of Pearson, Spearman or Multiple. The latter is the correlation equivalent of multiple regression. You can now select which variables are displayed, either from the complete lists or according to a minimum correlation criterion. You can also change the colour and font used for the vector overlay. If you click on the Correlations to worksheet button then the correlation values will be immediately saved to a worksheet.


