Experimental Supplements
advertisement
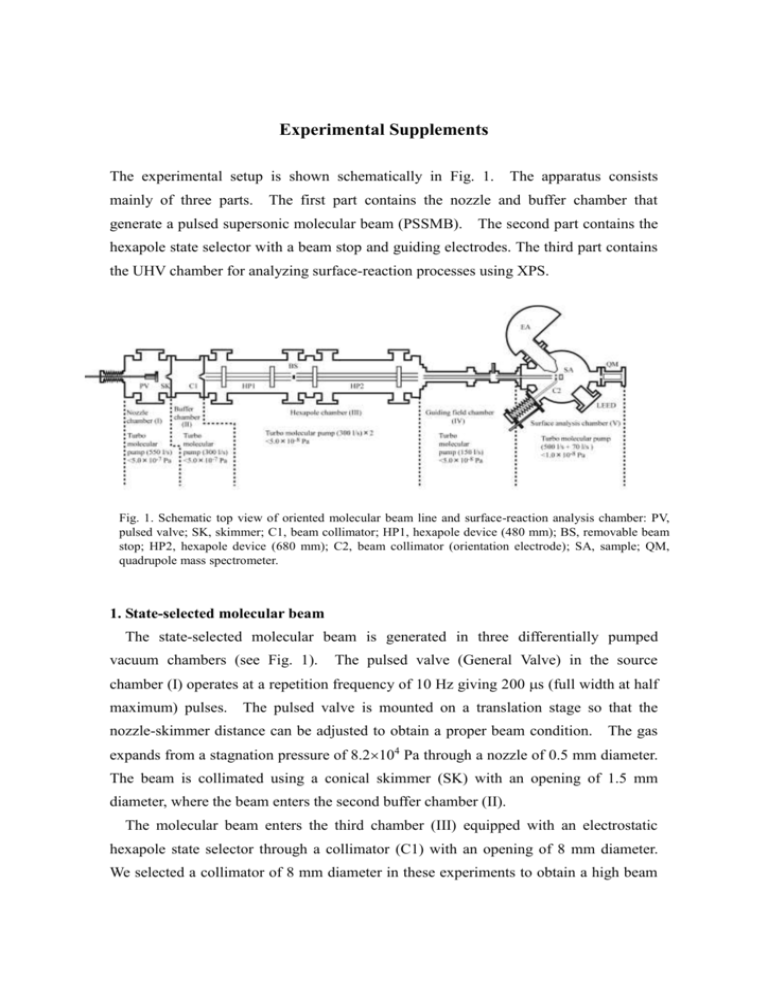
Experimental Supplements The experimental setup is shown schematically in Fig. 1. mainly of three parts. The apparatus consists The first part contains the nozzle and buffer chamber that generate a pulsed supersonic molecular beam (PSSMB). The second part contains the hexapole state selector with a beam stop and guiding electrodes. The third part contains the UHV chamber for analyzing surface-reaction processes using XPS. Fig. 1. Schematic top view of oriented molecular beam line and surface-reaction analysis chamber: PV, pulsed valve; SK, skimmer; C1, beam collimator; HP1, hexapole device (480 mm); BS, removable beam stop; HP2, hexapole device (680 mm); C2, beam collimator (orientation electrode); SA, sample; QM, quadrupole mass spectrometer. 1. State-selected molecular beam The state-selected molecular beam is generated in three differentially pumped vacuum chambers (see Fig. 1). The pulsed valve (General Valve) in the source chamber (I) operates at a repetition frequency of 10 Hz giving 200 s (full width at half maximum) pulses. The pulsed valve is mounted on a translation stage so that the nozzle-skimmer distance can be adjusted to obtain a proper beam condition. The gas expands from a stagnation pressure of 8.2104 Pa through a nozzle of 0.5 mm diameter. The beam is collimated using a conical skimmer (SK) with an opening of 1.5 mm diameter, where the beam enters the second buffer chamber (II). The molecular beam enters the third chamber (III) equipped with an electrostatic hexapole state selector through a collimator (C1) with an opening of 8 mm diameter. We selected a collimator of 8 mm diameter in these experiments to obtain a high beam intensity. Six polished stainless-steel rods, either 480 (HP1) or 680 (HP2) mm in length and 5 mm in diameter, are mounted parallel in a hexapole configuration on a circle with a diameter of 14 mm. The diameter of the inscribed circle on the rod surfaces is 9 mm. The six rods are supported using Macor glass connected to a high-precision aligner. Two sets of such hexapole state selectors, separated by 40 mm, are aligned. A removable beam stop (BS) of 3 mm diameter is inserted between the two separated state selectors to exclude non-state-selected beams and other contaminations (clusters) running along the center of the hexapole. We can apply DC voltages up to Vhex=12 kV to every other rod. After passing through the hexapole field, the state-selected molecular beam enters the guiding homogeneous electrostatic field. It is necessary to transport the state-selected beam to the sample in an adiabatic manner using a guiding electric field where a molecule can maintain its own selected rotational quantum numbers. Finally, the state–selected molecular beam is introduced into the UHV chamber for surface analysis through a collimator (C2) with an opening 3 mm in diameter, and then it is oriented using the homogeneous electric field produced between a removal plate with a collimator and the sample surface. The typical strength of the orientation field is 10 kV/cm for NO. This field strength is sufficient for obtaining almost perfect orientation of NO. At the perfect orientation for the |JM>=|1/2, 1/2, 1/2> state of NO, the average orientation of <cos>=0.33 is achievable, where the angle corresponds to the one produced by the dipole moment el and the orientation field E. Here, J, , and M are the quantum numbers corresponding to J, , and M; the total angular momentum J, its projection on the body-fixed molecular axis , and also the projection on the space-fixed axis defined by the electric field M. 2. UHV chamber A Si wafer (n-type, 1cm) with a misalignment below 0.2 was cut into a rectangle 1515 mm2 and rinsed in highly pure methanol before introducing it into the UHV chamber (V). The sample was cleaned by repeating cycles of 1.2 keV Ar+ sputtering (5 A cm-2, 30 min) and 2 min. annealing at 1200 K. The sharp (77) reconstructed pattern of clean Si(111) was observed at room temperature by low-energy electron diffraction (LEED) and no contamination was detected by XPS. In a separate chamber, a surface prepared in the same manner was observed by scanning tunneling microscopy (STM), and a well-defined (77) reconstructed structure was created on the surface at room temperature with a low defect density. A quadrupole mass spectrometer (QMS; Hyden) is used to measure of the density of impinging NO molecules. The QMS is located at the backside of the sample and is used to detect the direct beam profile. The particle multiplier can be used in either the analog current mode or single-pulse mode. The amplified signal is fed into a digital oscilloscope (Iwatsu-LeCroy LC574AL) in the analog mode to accumulate TOF spectra. In addition, the surface analysis chamber (Chamber V) is equipped with an X-ray source (Omicron DAR400) and a concentric hemispherical energy analyzer (Omicron EA125) with a 64-channel detector (Ulvac PHI) for XPS. Typically, XPS measurements are done using the Mg anode (Mg K 1253.6 eV, E=0.7 eV). The photoelectrons are detected in the surface normal with a pass energy of 40 eV. After dosing the molecular beams, we measure the XPS peaks of Si 2p, N 1s, and O 1s at 400 K. 3. Beam Characterization Figure 2 shows typical TOF beam profiles of the |JM>=|1/2, 1/2, 1/2> state for Ei=58 meV. The spectrum corresponds to the maximum of the peak of the focusing curve (Vhex= 4.6 kV) in Fig. 3. The NO beam intensity at Vhex= 4.6 kV, determined by the integration of the TOF peak, is ~11 times larger than that at Vhex= 0 kV. Such a Fig.2. TOF beam profiles for the NO SSMB with |JM>=|1/2, 1/2, 1/2>, measured with the beam stop removed. The average translational energies are Ei=58 [NO (20%)/Ar, dashed line] meV. small contribution of the direct non-state-selected beam enables us to carry out any experiments with the beam stop removed [BS in Fig. 1]. Since we use the pulsed beam generated by the pulsed valve as is, we cannot determine the exact velocity and its distribution in high accuracy in our TOF measurements. However, these measured incident energies agree well with those determined from simulations of the focusing curves of NO (vide infra). Thus, these Ei values have sufficiently accuracy for our TOF measurements. By integrating the TOF profiles, we can estimate the beam intensity IB. Figures 4 shows the focusing curves for the PSSMBs with Ei=58 meV impinging directly upon the QMS. Here, the intensity IB is plotted as a function of the absolute value of the voltage applied to the rods of the hexapole. There are several components in the focusing curves shown in Fig. 3. To assign the peaks to the proper rotational states, we carried out trajectory simulations of NO molecules. The simulated results indicated by solid lines are shown together with the experimental data in Fig. 3. From the best-fits of these simulated results, we can determine mean velocities of 610 m/s. The mean velocities agree well with those determined by TOF measurements. The rotational temperatures reproducing the focusing curves are 3.2 K for Ei=58 meV, respectively. As a result of simulation, the main peak in Fig. 2 is assigned to |JM>=|1/2, 1/2, 1/2>. The corresponding TOF profiles for this state are shown in Fig. 3. Based on the simulations, we can obtain the state distribution function WV(JM) of Fig. 3. Focusing curves for 58 meV [NO (20%)/Ar] . The contribution of the direct beam was subtracted. The full circles and full lines indicate the measured and simulated focusing curves, respectively. The dashed and dotted lines correspond the components of |JM>=|1/2, 1/2, 1/2> and |3/2, 1/2, 3/2>, in the simulated curves, respectively. Fig. 4. Polar plots of estimated orientation distribution WV(cos) for the NO (20%)/Ar SSMB at hexapole voltages of 4.6 (solid line) kV, together with the random orientation distribution (dotted line). The polar plots correspond to the N-end distribution of NO. The contribution of only state-selected beams is considered. the |JM> states at fixed Vhex, and thus the orientation distribution function WV(cos). The values of WV(cos) obtained for 58 meV at 4.6 kV is shown in a polar plot for the N-end distribution together with the random orientation distribution in Fig. 4. When we reverse the electric field, the distribution corresponds to the O-end distribution.


