Atomic origin of high glass forming ability of
advertisement
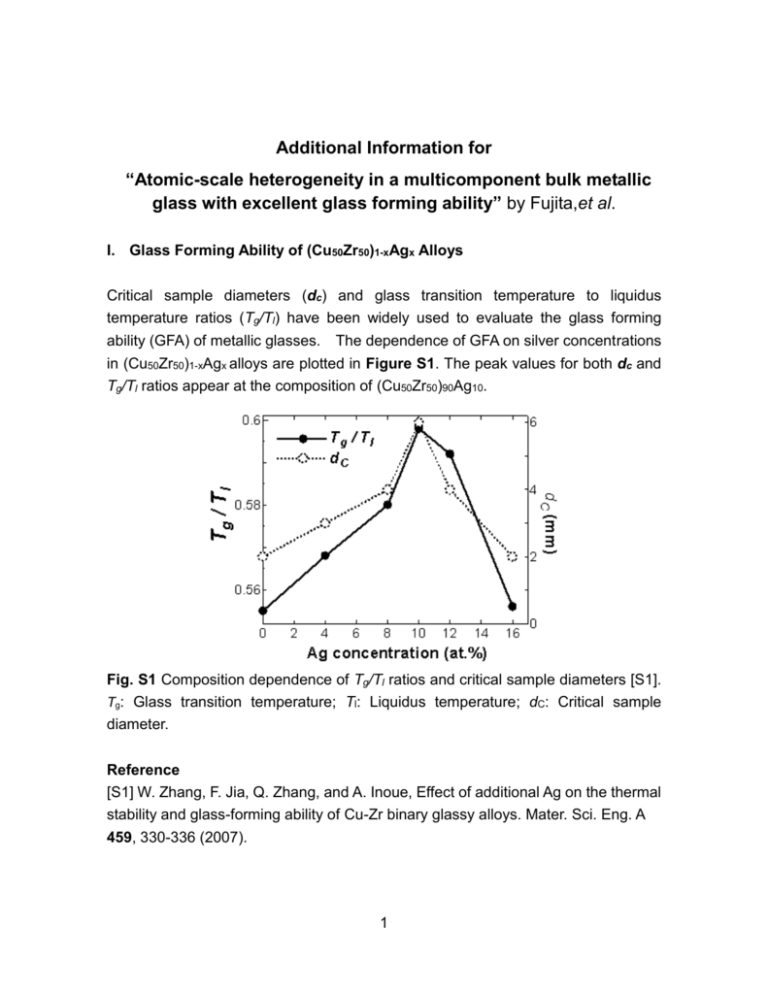
Additional Information for “Atomic-scale heterogeneity in a multicomponent bulk metallic glass with excellent glass forming ability” by Fujita,et al. I. Glass Forming Ability of (Cu50Zr50)1-xAgx Alloys Critical sample diameters (dc) and glass transition temperature to liquidus temperature ratios (Tg/Tl) have been widely used to evaluate the glass forming ability (GFA) of metallic glasses. The dependence of GFA on silver concentrations in (Cu50Zr50)1-xAgx alloys are plotted in Figure S1. The peak values for both dc and Tg/Tl ratios appear at the composition of (Cu50Zr50)90Ag10. Fig. S1 Composition dependence of Tg/Tl ratios and critical sample diameters [S1]. Tg: Glass transition temperature; Tl: Liquidus temperature; dC: Critical sample diameter. Reference [S1] W. Zhang, F. Jia, Q. Zhang, and A. Inoue, Effect of additional Ag on the thermal stability and glass-forming ability of Cu-Zr binary glassy alloys. Mater. Sci. Eng. A 459, 330-336 (2007). 1 II. Atomic Configuration and EXAFS Spectra of Cu50Zr50 Figure S2(a) show the predicted atomic configuration of the Cu50Zr50 metallic glass. on the basis of the atomic structure, we calculated the EXAFS spectra of Cu-K and Zr-K edges and compared with the experimental ones. The salient features of model(k) from the simulated configurations well match with those of the experimental spectra (Fig. S2 (b) and (c)). (a) Fig. S2 EXAFS k2 (k) of Cu50Zr50 obtained by experiments and model calculations using the 300 K ab initio simulated configuration. (a) ab initio simulated configuration of Cu50Zr50. The bronze and green balls represent Cu and Zr atoms, respectively. (b) EXAFS spectra of Cu-K; and (c) Zr-K edges. The blue lines indicate experimental data, while the red lines indicate calculated values from the ab initio model. 2 III. Atomic Configuration and EXAFS Spectra of Cu40Zr40Ag20 Fig. S3 EXAFS k2 (k) of Cu40Zr40Ag20 obtained by experiments and model calculations using the 300 K ab initio simulated configuration. (a) ab initio simulated configuration of Cu40Zr40Ag20. The bronze, green and light blue balls represent Cu, Zr and Ag atoms, respectively. (b) EXAFS spectra of Cu-K; (c) Zr-K; and (d) Ag-K edges. The blue lines indicate experimental data, while the red lines indicate calculated values from the ab initio model. 3 IV. Silver Distribution in the Simulated Atomic Structure (b) (a) Fig. S4 Distribution of Ag atoms in the 300 K ab initio simulated configuration of (a) Cu45Zr45Ag10, and (b) Cu40Zr40Ag20. Most of the Ag atoms exist in the form of atomic pairs or strings. V. Atomic Distribution of Ag-centered interpenetrating cluster in Liquid Fig. S5 Distribution of extended icosahedron-like clusters center by paired Ag atom in the 2500 K ab initio simulated structure of Cu45Zr45Ag10. The red lines represent Ag-Ag bonds. 4 VI. Atomic Distribution of Ag in MD simulation (a) (b) 1 nm Fig. S6 Atomic distribution of Ag atoms in the MD simulated structure of Cu45Zr45Ag10 at (a) 2500 K and (b) 300 K. The percentages of the paired Ag atoms in 8,000 atoms in (a) and (b) are 82 % and 93 %, respectively. Fig. S7 Atomic distribution of Ag atoms in the MD simulated structure of Cu40Zr40Ag20 at 300 K. Significant Ag phase separation can be observed. 5 VII. Fragility plot of the Relaxation Time To understand the silver effect on the stabilization of the supercooled liquid, the fragilities of the Cu50Zr50 and Cu45Zr45Ag10 alloys were characterized by measuring the heating rate dependence of Tg. The inverse heating rate is plotted as a function of Tg normalized by Tg* that is measured at the heating rate of 0.067 K/s. From the “fragility” plots (Fig. S8), it can be found that Cu45Zr45Ag10 shows stronger heating rate dependence than that of Cu50Zr50, implying the fragility is decreased by the Ag addition. The fragility parameter (D*) is determined by fitting the experimental data by the Vogel-Fulcher-Tamman (VFT) equation and the D* of Cu45Zr45Ag10 and Cu50Zr50 are about 24 and 11, respectively. The larger D* of Cu45Zr45Ag10 indicates higher viscosity, lower diffusivity and higher stability of the supercooled liquid. Fig. S8 The fragility plots of the Cu50Zr50 and Cu45Zr45Ag10 alloys 6
